REQUEST A DEMO with a GFDFinaeon Specialist


The Course of the Exchange made the first attempt to break the stock market down into sectors in 1811 when it expanded its coverage of stocks to include shares other than the three sisters, the Bank of England, South Sea stock and East India Company that dominated the English stock market in the 1700s.
Twenty securities were listed in The Course of the Exchange from 1747 to 1811 as a group. On January 1, 1811, coverage expanded to two pages and stocks were divided into different sectors: canals, docks, assurance, water works and miscellaneous companies. On August 30, 1811, Iron Railways were added as a sector, including the
...
The equity-risk premium (ERP) is one of the most important variables in finance. In theory, riskier stocks should provide a higher return than risk-free government bonds, but unfortunately, this is not always true. Different factors drive return to stocks and bonds. Bond returns are driven by inflation; stock returns are driven by corporate cash flows. The two will vary independently of one another. It is not risk alone that determines the equity-risk premium.
 Global Financial Data is completing its collection of data for the English stock market. The UK stocks database includes data on 25,000 companies from 1657 when the East India Company started trading in London to 1985.
GFD has written two other articles, “Four Centuries of Global Leadership” and “Two Centuries of American Leadership” which analyze how leadership in the global and American economies, with leadership defined as the largest listed company by...
Global Financial Data is completing its collection of data for the English stock market. The UK stocks database includes data on 25,000 companies from 1657 when the East India Company started trading in London to 1985.
GFD has written two other articles, “Four Centuries of Global Leadership” and “Two Centuries of American Leadership” which analyze how leadership in the global and American economies, with leadership defined as the largest listed company by...
 Global Financial Data has the most extensive database on historical stocks available anywhere in the world. GFD has collected data on stocks that listed on the London Stock Exchange from the 1600s until 2018. London was the financial center of the world until World War II, and many companies in emerging markets listed their shares on the London Stock Exchange before a stock exchange even existed in that country. After World War I, many companies listed on...
GFD has calculated a global index of stocks that begins in 1602 and continues until the present. With this index, we can track the changes in global stock markets over the past 400 years, determine when bear markets occurred and study the causes of those bear markets.
We have already shown that you can divide up the history of equity markets into four eras: the period of Mercantilism (1600-1799) during which a few international trade companies dominated stock exchanges, Free Trade (1800-1914) during which railroads, finance and other industries grew in size, Regulation (1914-1981) during which government regulation and
...
GFD is revising its stock index for Australia because it can now use data on Australian shares that were listed in London to supplement the data that already exists from Sydney and other Australian exchanges. Australia has one of the highest returns of any stock market in the world, but this is in part due to problems with the indices that were calculated in the 1950s and the biases in that data. Historical data for Australia was calculated by Lamberton in the 1950s, but the data are limited to commercial companies and ignores returns to mining and finance companies. A similar problem exists with the indices calculated by Schumann
...
Many people believe that Abraham Lincoln was the greatest President of the United States. Not only did his steadfast leadership help the United States to survive the Civil War, but as President he pursued his vision of a united country, free from slavery and war. Lincoln’s vision of America went beyond winning the Civil War and freeing the slaves and extended to uniting the East and West by building a transcontinental railroad across the United States. As President, Lincoln was instrumental in approving the three routes that eventually crossed the continent to bring the two halves of the country together and ensure that the United States
... We know that the worst bear market in United States history occurred between 1929 and 1932 when the S&P Composite fell 86%, returning the stock market back to levels it hadn’t seen since the 1800s. But what is the longest bear market and how long did it last?
To answer this question, you have to understand GFD’s definition of a bear market as a 20% decline in the stock market and a bull market as a 50% increase in the stock market. If the stock market...
We know that the worst bear market in United States history occurred between 1929 and 1932 when the S&P Composite fell 86%, returning the stock market back to levels it hadn’t seen since the 1800s. But what is the longest bear market and how long did it last?
To answer this question, you have to understand GFD’s definition of a bear market as a 20% decline in the stock market and a bull market as a 50% increase in the stock market. If the stock market...
 Global Financial Data has produced indices that cover global markets from 1601 until 1815 as a first step toward creating a World Index that provides data on equities from 1601 until 2018. As we have discussed in another blog, “The Fifth Financial Era: Singularity,” you can divide financial market history over the past 400 years into four eras of Monopolies and Funds (1600-1815),
 Global Financial Data has added Share Value Indices for over 90 global markets with over a century of data for major countries. Share value indices allow analysts to determine how the number of shares outstanding has changed over time in order that they can differentiate between changes in price as a source of changes in market capitalization and changes in the number of shares outstanding in market capitalization.
Market capitalization is calculated by...
Global Financial Data has added Share Value Indices for over 90 global markets with over a century of data for major countries. Share value indices allow analysts to determine how the number of shares outstanding has changed over time in order that they can differentiate between changes in price as a source of changes in market capitalization and changes in the number of shares outstanding in market capitalization.
Market capitalization is calculated by...

Figure 1. S&P 500, 2009 to
 When most people think of Venice, they think of the visuals of Venice: the canals, the gondoliers, the paintings by famous artists such as Canaletto or Titian, the Bienniale, or St Mark’s Square (named after the saint whose relics the Venetians stole from Alexandria in 828 by hiding them beneath pork to get them past the Muslim inspectors) and its pestering pigeons.

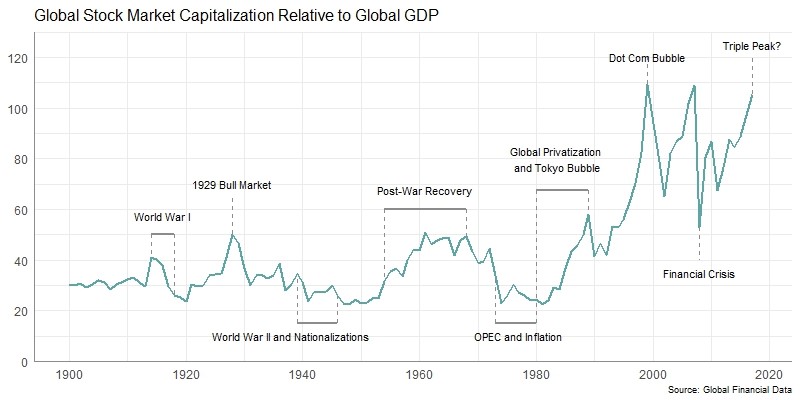
The Great Bull Market of 2009 to 2019 continues to push the stock market to new highs. The capitalization of the New York Stock Exchange and NASDAQ is now about $37.5 trillion which is equal to 174% of America’s Gross Domestic Product. If the market continues to rise, the American stock market will soon have its largest Market Capitalization/GDP Ratio (MCap/GDP) in history.
The American stock market first exceeded 100% of GDP in September 1929 before it crashed to its 1932 lows at less than 25% of GDP. The stock market’s capitalization didn’t exceed GDP again until 1996. The Dot.com Bubble of the late 1990s pushed the
... One of the long-term components of the Dow Jones Industrial Average has been IBM. The company was originally added to the Dow Jones Industrials on March 26, 1932 in a reshuffle involving eight stocks including Coca-Cola, Nash Motors (later American Motors) and Proctor & Gamble. On March 13, 1939, however, both IBM and Nash Motors were removed from the average and replaced by American Telephone & Telegraph and United Aircraft Corp. (now United...

I often crave donuts being the sugar lover that I am. And I am not alone here at Global Financial Data. On the way to the office there is a local Donut shop called Rose Donuts & Cafe, which has the best donuts as is depicted in Figure 1 — fluffy, fresh, overly large delights such as maple bars, cake donuts, sprinkles, chocolate glazed, old fashioned, Bavarian crème filled goodies, and cinnamon rolls so large you could quarter them and still be stuffed. So many flavors to choose from, French-croissants and fresh baked muffins.

S&P 500: 514.71 (vs. 2783.36 in 04/2020) 10-year U.S. Government Bond Yield: 7.07% (vs. 0.63% in 04/2020) Gold: $389.75 (vs. $1718.65 in 04/2020) Oil: $20.355 (vs. $19.96 in 04/2020) GBP/USD: 1.612 (vs. 1.2488 in 04/2020) US GDP: $7,455 billion (vs. $21,734 billion in 12/2019) US Population: 266 million (vs. 329 million in
...


25 years ago: December 1994
S&P 500: 459.27 (vs. 3132.52 in 12/2019)
10-year U.S. Government Bond Yield: 7.84% (vs. 1.85% in 12/2019)
Gold: $383.25 (vs. $1461.70 in 12/2019)
Oil: $17.765 (vs. $58.99 in 12/2019)
GBP/USD: 1.566 (vs. 1.3115 in 12/2019)
US GDP: $7,331 billion (vs. $21,542 billion in 09/2019)
US Population: 260 million (vs. 329 million in 2019)
12/01/1994: Orange County, Calif., says the value of its investment fund has dropped by an estimated $1.5 billion, as rising interest rates hurt derivatives in its highly leveraged
...


25 years ago: January 1995
S&P 500: 470.42 (vs. 3253.05 in 01/2020)
10-year U.S. Government Bond Yield: 7.60% (vs. 1.85% in 01/2020)
Gold: $374.90 (vs. $1571.95 in 01/2020)
Oil: $18.405 (vs. $59.65 in 01/2020)
GBP/USD: 1.5785 (vs. 1.3077 in 01/2020)
US GDP: $7,331 billion (vs. $21,542 billion in 09/2019)
US Population: 266 million (vs. 329 million in 2019)
01/02/1995: Mexico develops a rescue plan to deal with the crisis sparked by last month’s peso devaluation.
01/03/1995: The U.S. and China move close to a trade war as President Clinton
...


25 years ago: May 1994
S&P 500: 456.50 (vs. 2881.40 in 05/2019)
10-year U.S. Government Bond Yield: 7.17% (vs. 2.47% in 05/2019)
Gold: $387.60 (vs. $1287.10 in 05/2019)
Oil: $18.295 (vs. $61.65 in 05/2019)
GBP/USD: 1.5105 (vs. 1.2999 in 05/2019)
US GDP: $7,115 billion (vs. $21,062 billion in 03/2019)
US Population: 260 million (vs. 328 million in 2019)
05/04/1994: The White House recruits central banks around the world to buy the flagging dollar in the biggest show of force currency markets have seen in a decade. Israeli Prime Minister Yitzhak Rabin and PLO leader Yasser Arafat

25 years ago: November 1995
S&P 500: 605.37 (vs. 3550.50 in 11/2020)
10-year U.S. Government Bond Yield: 5.76% (vs. 0.96% in 11/2020)
...

 Yields on United States 10-year bonds rose above 3% at the beginning of January 2014. The yield on the 10-year had reached its lowest point in history in July 2012 at 1.43% as a result of the Fed’s policy of Quantitative Easing. Since then yields have doubled as markets have incorporated expectations of Fed tapering the purchase of U.S. Government securities.
 During the 1800s, the transport and finance sectors represented the majority of the stock market capitalization in the United Kingdom. As Figure 1 shows, in 1800, finance represented about 90% of stock market capitalization. This fell to around 60% in 1807 when data on canals became available, and 35% in the 1840s when the Railway Mania occurred. Similarly, transports represented about 30% of stock market capitalization between 1807 and the 1830s, rising...
 Global Financial Data has collected data on the London Stock Exchange and the United States stock exchanges as well as data on individual companies over the past 400 years. This data covers all the major companies that have listed in London, New York, Paris and Amsterdam during the past four centuries. This data provides us with a fascinating glimpse into how global leadership has changed over the past 400 years. GFD has put together a ...
 The graph below illustrates the history of global stock markets by capitalization from 1900 to 2018. The graph uses the World Federation of Exchanges definitions and divides the world into three groups: the Americas which includes both North and South America, Europe/Africa/Middle East, and Asia and Oceania. It shows how each continent’s share of global Stock market capitalization has changed over time. The Americas represented the majority of global market...
 Global Financial Data has added 67 years of data and over 13,000 daily data points to the Dow Jones Transportation Average. GFD’s version of the average now begins in 1832 and provides daily data covering 185 years.
The Dow Jones Transportation Average was introduced on September 23, 1889 and included 18 railroad stocks and 2 industrial stocks. On October 26, 1896, the two industrial stocks were removed from the railroad average when Dow Jones started...
Global Financial Data has added 67 years of data and over 13,000 daily data points to the Dow Jones Transportation Average. GFD’s version of the average now begins in 1832 and provides daily data covering 185 years.
The Dow Jones Transportation Average was introduced on September 23, 1889 and included 18 railroad stocks and 2 industrial stocks. On October 26, 1896, the two industrial stocks were removed from the railroad average when Dow Jones started...

Existing calculations of long-term stock market returns in the United States are based upon four primary sources: Smith and Cole (1803-1862), Macaulay (1857-1871) Cowles (1871-1928) and Standard and Poor’s (1928-2017). Unfortunately, these indices have major flaws in them that create biases that researchers have tolerated until now because no one has ever collected historical data on U.S. share prices, corporate actions (dividends and splits) and shares outstanding so accurate price and return indices could be calculated. The current S&P Composite includes data from the Cowles Indices from 1871 until
...
The 2020s have begun. During the 2010s, the fixed-income market has done things no one would have predicted when the 2010s began ten years ago. The most important feature of the past decade has been the steady decline in government bond yields, falling to negative nominal yields in most of Europe and negative real yields in the United States and Canada.
Government bond yields have been declining since 1981 throughout the world. In the United States, the 10-year bond yield was 3.85% at the end of 2009, but has declined to under 1.90% today. The yield on 10-year government bonds in Japan has declined from 1.30% in 2009 to
... Once again, the government has cut a deal to avoid defaulting on its debt by raising the debt ceiling. The chance of the United States defaulting on its debt has been avoided, at least until January 15, 2014.
The reason for these dramatic battles over the debt ceiling is that originally, each bond issue by the government had to be approved by Congress. When the United States entered World War I, instead of requiring that the government approve each and every...
Once again, the government has cut a deal to avoid defaulting on its debt by raising the debt ceiling. The chance of the United States defaulting on its debt has been avoided, at least until January 15, 2014.
The reason for these dramatic battles over the debt ceiling is that originally, each bond issue by the government had to be approved by Congress. When the United States entered World War I, instead of requiring that the government approve each and every...

Most people know the basic story of the French Revolution. France’s aid to the United States indebted the nation leading to new taxes that fed a revolt against the king and the aristocracy. The Estates General was convened in May 1789, and on July 14, 1789, the Bastille was stormed marking the beginning of the French Revolution. The Declaration of the Rights of Man was passed and feudalism was abolished in August 1789. France became a republic in September 1792 and in January 1793, King Louis XVI was executed. A dictatorship gained power in 1793 under Robespierre and the Committee of Public Safety which introduced the Reign of Terror.
... Although most dividends are paid in cash, companies are free to provide their shareholders with any type of dividend they want, including shares of stock or dividends in kind. Although the people on Wall Street often behave like they are a bunch of drunks, that doesn’t mean they are drinking, or that the companies they have ownership in are giving away free liquor, but we have found three cases where that did happen. Two of these, by National Distillers...

On December 9, Paul Volcker, who served as Chairman of the Federal Reserve Bank from 1979 to 1987, died at the age of 92. Paul Volcker changed the shape of the economy and of financial markets.
The Rise and Fall of Interest Rates
Paul Volcker is known for two things. He instituted the Volcker Rule as part of the Dodd-Frank Wall Street Reform and Consumer Protection Act. This prohibited banks from conducting some investment activities with their own accounts and limited their dealings with hedge funds and private equity funds.
...
 Today Pepsi is one of the strongest brands in the world with a capitalization of nearly $125 billion. But this wasn’t always the case. It may be hard to believe, but Pepsi was on the verge of bankruptcy during its first forty years of business. In fact, Pepsi-Cola’s financial situation was so bad that three times between 1922 and 1934, Pepsi-Cola approached Coca-Cola and offered to sell out to their competitor. All three times Coca-Cola rejected their...
 |
Dr. Bryan Taylor, President and Cheif Economist for Global Financial Data, speaks with KPCW, Mountain Money about the impacts the Spanish Flu had on the stock market in 1918 and how we can look at that data to understand the current market and impacts from |

Global Financial Data has collected extensive data on stocks from the United States and the United Kingdom covering over 400 years. With this, GFD plans to generate indices that cover the history of the stock market from the incorporation of the Dutch East India Company in 1602 to the current market in 2018. GFD will provide a general index, sector indices and size indices.
One question which the creation of size indices creates is how many components should be in the large cap, midcap and small cap indices. Where should large cap, midcap and small cap begin and end? Currently, each index company treats large cap, midcap and
...
 Would you have liked to have invested in the greatest invention of all time? A machine that almost revolutionized the world and could have provided cheap, efficient energy to mankind for centuries to come! Then John Keely had the machine for you. Once perfected, the “hydro-pneumatic pulsating vacuo-motor engine” would have been used by every person in the world and would have made you rich. If you wanted to profit
 Although, few people may realize it, we may be seeing the first generation of kids that will not need to know how to drive a car. With all the changes that are going on in the automobile industry, this is a distinct possibility. Not since the introduction of cars over 100 years ago has the automobile industry gone through so many changes so quickly. Between electric cars and self-driving cars, automobiles as we know them may not even exist 20 years from...

GFD has calculated a global index of stocks that begins in 1602 and continues until the present. With this index, we can track the changes in global stock markets over the past 400 years. In particular, we can determine when bear markets occurred and study the causes of those bear markets.
The number of stocks used in the index has grown over time. Data from the 1600s is based upon the data for only one stock, the Dutch West India Co., so any analysis of bear markets during the seventeenth century would only look at the behavior of one stock, not of the global market. There is virtually no data from Amsterdam between 1692 and
... Although few people realize it, the Great Depression hit Europe when the Creditanstalt bank of Vienna collapsed in May 1931 and began a domino effect that spread to the rest of Europe. The collapse of the Creditanstalt is seen as the trigger to the great deflationary spiral in Europe between 1931 and 1933. The reason for the impact of the Creditanstalt on Germany and the rest of Europe was that it not only was the largest bank in Austria, but it was...
 We recently wrote a blog on Tom Moore’s Distillery which along with Park and Tilford and the National Distillers Products Corp. paid dividends in whiskey to their shareholders. Companies are not required to pay out cash dividends, and they can pay out in-kind dividends in any way they want. Back in the 1980s, Ranchers Exploration and Development Corp. paid their dividends in bars of gold and silver!
 Confederate bonds are now prized by collectors of Confederate memorabilia. Since the bonds were never redeemed, thousands of these remnants of the South still exist for anyone to own.
One of the more interesting bonds produced by the Confederacy were the Erlanger bonds which were issued in London in an attempt to raise much needed foreign currency for the Confederacy. These bonds were authorized by an Act of the Confederacy on January 29, 1863, and...
Confederate bonds are now prized by collectors of Confederate memorabilia. Since the bonds were never redeemed, thousands of these remnants of the South still exist for anyone to own.
One of the more interesting bonds produced by the Confederacy were the Erlanger bonds which were issued in London in an attempt to raise much needed foreign currency for the Confederacy. These bonds were authorized by an Act of the Confederacy on January 29, 1863, and...
 Global Financial Data has produced indices that cover global markets from 1601 until 2018. In organizing this data, we have discovered that the history of the stock market over the past 400 years can be broken up into four distinct eras when economic and political factors affected the size and organization of the stock market in different ways. Politics and economics define the limits of financial markets by determining whether companies can exist in the...
 The Vereenigde Oost-Indische Compagnie (VOC), or the United East India Company, was not only the first multinational corporation to exist, but also probably the largest corporation in size in history. The company existed for almost 200 years, from its founding in 1602, when the States-General of the Netherlands granted it a 21-year monopoly over Dutch operations in Asia, until its demise in 1796. During those two centuries, the VOC sent almost a million...
 The Vereenigde Oost-Indische Compagnie (VOC), or the United East India Company, was not only the first multinational corporation to exist, but also probably the largest corporation in size in history. The company existed for almost 200 years from its founding in 1602, when the States-General of the Netherlands granted it a 21-year monopoly over Dutch operations in Asia until its demise in 1796. During those two
 Apple is fast approaching a market capitalization of $1 trillion. Their current market cap is about $900 million and an 11% increase in their stock price will make Apple the first $1 trillion company. It was only back in 1970 that the capitalization of the entire United States stock market hit $1 trillion and soon a single company may be worth that much.
Actually, one company did briefly break the trillion-dollar market cap several years ago. When PetroChina...
Apple is fast approaching a market capitalization of $1 trillion. Their current market cap is about $900 million and an 11% increase in their stock price will make Apple the first $1 trillion company. It was only back in 1970 that the capitalization of the entire United States stock market hit $1 trillion and soon a single company may be worth that much.
Actually, one company did briefly break the trillion-dollar market cap several years ago. When PetroChina...
Global Financial Data has produced indices that cover global markets from 1601 until 2018. In organizing this data, we have discovered that the history of the stock market over the past 400 years can be broken up into four distinct eras when economic and political factors affected the size and organization of the stock market in different ways. Politics and economics define the limits of financial markets by determining whether companies can exist in the private or the public sector, by controlling the flow of capital in financial markets, and by determining the level of regulation that companies face in maximizing
... Today, the future of energy prices is as uncertain as ever. Whereas in the 1970s, there was a fear that the supply of oil could decline dramatically, causing future oil prices to rise, fracking and other technological innovations have increased oil reserves to levels never before seen in history. At the same time, natural gas is becoming a clean substitute for petroleum, and because of concerns over global warming,
 Invest $1 in 1948 and have $48,000 today! With the recent IPOs of Twitter and Facebook, two of the largest social/entertainment media giants, one would imagine that investing in those companies would pay big compared to the Walt Disney Co. However, the Walt Disney Co. outperformed them both by comparison in its day, and did it with an interesting story to tell.
Today, employees and venture capitalists reap
Invest $1 in 1948 and have $48,000 today! With the recent IPOs of Twitter and Facebook, two of the largest social/entertainment media giants, one would imagine that investing in those companies would pay big compared to the Walt Disney Co. However, the Walt Disney Co. outperformed them both by comparison in its day, and did it with an interesting story to tell.
Today, employees and venture capitalists reap Though few people have heard about the collapse of the Hatry Group of companies in September 1929, some people have claimed that it triggered the New York stock market crash of October 1929 and ultimately the Great Depression. Our review of the facts has led us to believe that the collapse of the Hatry Group had little impact on financial markets, despite the claims to the contrary. Hatry no more caused the
 The Panic of 1857 was one of the first global panics in financial history. The failure of the Ohio Life Insurance and Trust Co. of Cincinnati, Ohio precipitated a world-wide panic that would last for the next two years.
The Panic of 1857 traces its origins back to the Crimean War which was fought between 1853 and 1856 between Russia and the Ottoman Empire, France, Britain and Sardinia over the rights of Christians in the Holy Land. During the war, many...
The Panic of 1857 was one of the first global panics in financial history. The failure of the Ohio Life Insurance and Trust Co. of Cincinnati, Ohio precipitated a world-wide panic that would last for the next two years.
The Panic of 1857 traces its origins back to the Crimean War which was fought between 1853 and 1856 between Russia and the Ottoman Empire, France, Britain and Sardinia over the rights of Christians in the Holy Land. During the war, many...
 Global Financial Data has put together indices of the St. Petersburg Stock Exchange before World War I and the collapse of Russia into Communism. The data was made available to us from Yale’s International Center for Finance. The files were marked in transliterated Cyrillic, so we converted the names back into Cyrillic and then translated the names of the companies into English. We then classified the stocks according to their sector so we could see how one sector did relative to the
 When Standard and Poor’s introduced the S&P 500 index in March 1957, it revolutionized the index world and created a benchmark for the stock market that is still used today. The original S&P 500 index included 425 industrial stocks, 15 rail stocks and 60 utility stocks. The S&P 500 maintained this composition until July 1976 when finance stocks were added to the index. The index included 400 industrials, 40 utilities, 40 finance and 20 transport...
 The House of Representatives has begun an inquiry into impeaching President Trump. This will make Trump only the fourth President to face an impeachment inquiry. Andrew Johnson was impeached in 1868, but the Senate failed to remove him from office by one vote. President Nixon faced impeachment in 1974, but resigned rather than be removed from office. President Clinton was impeached in 1998, but the Senate failed to remove him from office. Although there...
 Canada has an interesting stock market history because in addition to its stock exchanges in Montreal and Toronto, shares in Canadian companies also traded in London and New York. Canada was a British colony until 1867 when it gained its independence from the United Kingdom, and many Canadian securities were traded in London until World War I, though many of the securities listed in London were traded in Canadian Dollars, not British
 The article Four Centuries of Global Leadership tracked the largest company in the world from 1602 to 2018. This article focuses on the United States, detailing how leadership, in terms of the company with the largest market cap, has changed over the past two centuries.
The table which accompanies this article provides a unique history of the United States...
The article Four Centuries of Global Leadership tracked the largest company in the world from 1602 to 2018. This article focuses on the United States, detailing how leadership, in terms of the company with the largest market cap, has changed over the past two centuries.
The table which accompanies this article provides a unique history of the United States...

This is the third in a series of blogs we are writing about global bear markets that have occurred over the past 400 years. Global Financial Data has calculated a World Stock Index that covers equities from 1602 until the present. The index included only one company in the 1600s, a handful of international trading companies in the 1700s, ten stock markets in the 1800s and all developed markets in the 1900s. Today there are over 100 stock markets throughout the world with about 25 developed markets, 25 emerging markets and 50 frontier markets.
The 1700s was a century of war during which there were five bear markets, each driven
... Yields on United States 10-year bonds rose above 3% at the beginning of January. The yield on the 10-year had reached its lowest point in history in July 2012 at 1.43% as a result of the Fed’s policy of Quantitative Easing. Since then yields have doubled as markets have incorporated the impact of the Fed tapering their purchase of U.S. Government securities.
This raises the question, how high could interest rates go from here? Could interest...
Yields on United States 10-year bonds rose above 3% at the beginning of January. The yield on the 10-year had reached its lowest point in history in July 2012 at 1.43% as a result of the Fed’s policy of Quantitative Easing. Since then yields have doubled as markets have incorporated the impact of the Fed tapering their purchase of U.S. Government securities.
This raises the question, how high could interest rates go from here? Could interest...
 This month the world is marking the 100th anniversary of the end of World War I which officially ended at 11 am on November 11, 1918. Few people, however, have talked about the impact of the Great War on financial markets, both during and after the war was over. Global stock markets closed when World War I began and the globalized economy which existed on July 31, 1914 didn’t return for 75 years.
Before World War I began, the world’s financial markets were...
This month the world is marking the 100th anniversary of the end of World War I which officially ended at 11 am on November 11, 1918. Few people, however, have talked about the impact of the Great War on financial markets, both during and after the war was over. Global stock markets closed when World War I began and the globalized economy which existed on July 31, 1914 didn’t return for 75 years.
Before World War I began, the world’s financial markets were...
Our comprehensive financial databases span global markets offering data never compiled into an electronic format. We create and generate our own proprietary data series while we continue to investigate new sources and extend existing series whenever possible. GFD supports full data transparency to enable our users to verify financial data points, tracing them back to the original source documents. GFD is the original supplier of complete historical data.
| 29122 Rancho Viejo Road, Suite 214, San Juan Capistrano, CA 92675 | |
| 949.542.4200 |
