

Global Financial Data tracks bull and bear markets in over 100 stock markets. We have calculated when bull and bear markets have begun and ended throughout the world beginning in 1602. We have over 100 years of data to analyze when bull and bear markets have begun and the number of market tops and bottoms that have occurred each year. GFD defines a bear market as a 20% decline in the primary market index for each country and a bull market as a 50% increase in the primary market index. A market top occurs when the index declines by 20% or more after a 50% increase, and a market bottom occurs when the market rises by 50% after a 20% decline.

Co-Authored by Michelle Kangas & Dr. Bryan Taylor
Warrant Buffett once said that the stock market capitalization to GDP Ratio (MC/GDP) is “probably the best measure of where valuations stand at any given moment.” Global Financial Data has decided to follow in Warren Buffett’s footsteps and has added data on the ratio of stock market capitalization to GDP for all the stock markets in the world. GFD has the most extensive historical data on stock market capitalization and GDP available anywhere. This enables us to provide data on Buffett’s favorite indicator going back centuries, not decades. MC/GDP data for the United States begins in 1792 and data for the United Kingdom begins in 1688.
There are several factors which influence the ratio of stock market capitalization to GDP. First, countries with more multinational companies have a higher ratio than countries without. The MC/GDP ratio is particularly high for Switzerland and Hong Kong because those countries have numerous multinationals listed on their exchanges. Switzerland’s MC/GDP ratio is over 200% and Hong Kong’s ratio is over 1000%. Second, interest rates influence the ratio. Bond yields provide an opportunity cost for investing in the stock market. The higher bond yields are, the lower will be the MC/GDP ratio. The lower bond yields are, the higher will be the ratio. Third, government ownership of major industries, banks and utilities reduces the MC/GDP ratio because these industries are publicly owned rather than privately owned. Fourth, industrialization of the economy increases the MC/GDP ratio and has generally increased over time. Fifth, whether a country relies more on markets or banks to direct capital to industry affects this ratio. Anglo-Saxon countries generally rely more on stock markets than continental European countries and tend to have a higher MC/GDP ratio. Sixth, wars tend to redirect capital to funding government bonds and increases regulation of industry. This tends to reduce the MC/GDP ratio. All of these factors should be taken into consideration when trying to analyze whether the MC/GDP ratio indicates that the stock market is overvalued or undervalued for any country.
GFD has created a simple mnemonic that enables subscribers to quickly find data for the country they are interest in. The ticker begins with “SC”, then adds the ISO code, then adds “MPC” at the end, so the symbol for the market cap of the United States as a share of GDP is SCUSAMPC and for Canada it is SCCANMPC.
There are many things that subscribers can do with this information. Figure 1 compares the stock market capitalization of the United States with the outstanding government debt as a share of GDP. Several of the factors mentioned above are clearly visible. The inverse correlation between war, stock market capitalization and debt is visible during World War I and World War II. The impact of rising interest rates in the 1970s and falling interest rates since 1981 have clearly impacted the MC/GDP ratio. Since 1980, both the debt/GDP and the MC/GDP ratios have risen. Over the past 50 years, the United States has deregulated many markets which has contributed to the increase in the MC/GDP ratio.
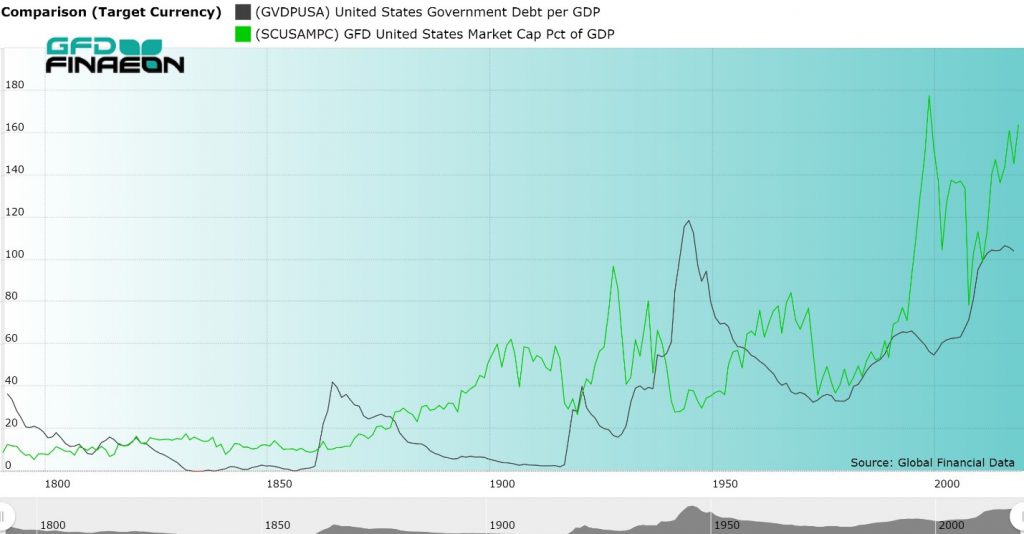
Figure 1. United States Government Debt and Stock Market Capitalization to GDP, 1792 to 2018
Global Financial Data provides data on the MC/GDP ratio for every major stock market in the world. GFD provides more history for this ratio than any other data vendor. The MC/GDP ratio in the United States is around 164% today. This is one of the highest ratios in history; however, bond yields are also at their lowest levels in history. Could the MC/GDP ratio be headed to 200% as in Switzerland, or does the high ratio portend a crash as occurred at previous peaks in 1999 and 2007? Time will tell.

The equity-risk premium (ERP) is one of the most important variables in finance. In theory, riskier stocks should provide a higher return than risk-free government bonds, but unfortunately, this is not always true. Different factors drive return to stocks and bonds. Bond returns are driven by inflation; stock returns are driven by corporate cash flows. The two will vary independently of one another. It is not risk alone that determines the equity-risk premium. Any review of the equity-risk premium shows that its value is not constant, and even if you average returns over 10 or 20 years, the premium can vary dramatically. Using GFD’s data, analysis of the evolution of the equity-risk premium over the past 300 years is possible. . Information on the Equity Risk Premium in 20 countries can be found in the GFD Guide to Global Stock Markets.
The US Takes a Wild Ride on the ERP

Figure 1. 10-year Returns to Stocks and Bonds in the United States, 1792 to 2023
The 10-year return to stocks and bonds in the United States is illustrated in Figure 1. The black line represents the return to stocks, and the green line, the return to bonds. The 10-year return to stocks between from 2012 to 2022 was 12.45%. An investment in bonds returned 0.20% during the same time period and the equity premium would have been 12.25%.
As Figure 1 illustrates, the return to stocks is more volatile than the return to bonds. The 10-year return to stocks fell from 19.87% in 1999 to -2.34% in 2009. During that same period the return to government bonds fell from 7.98% to 6.40%. The return to stocks greatly influences the equity-risk premium as can be seen by the volatile returns in Figure 1 relative to the slower change in the return to bonds.
There is a strong correlation between the current yield on government bonds and the total return over the subsequent 10 years. Few people realize that you can use the yield to predict the future return on government bonds. The market would predict that investors will receive about a 4% return on government bonds between 2023 and 2033.
The black line shows the yield in 2022 and the green line shows the return to bonds between 2012 and 2022. As bond yields declined between 1981 and 2019, fixed-income investors received capital gains that largely offset the decline in bond yields. Although yields fluctuate up and down from year to year, bond yields can trend up or down for decades. Bond yields generally declined from 1920 until 1945, rose until 1981 and declined until 2021. They have increased from a low of 0.5% in 2020 to over 4% now.

Figure 2. United States 10-year Government Bond Yield and Returns, 1920 to 2023
Now Trending 100 Years
Unfortunately, there is no similar indicator to predict future returns to stocks. Dividend yields don’t change very much, but the price of stocks do. Nevertheless, using a 10-year average return shows that the return to stocks does trend over time; however, the trends are shorter than the trends in risk-free bonds. During the past 100 years, 10-year peaks in the return to stocks occurred in 1928, 1958 and 1999. Peaks in the return to bonds occurred in 1930 and 1991. 10-year bottoms occurred in stocks in 1938, 1974 and 2009 and in bonds in 1959 and 2018. There have basically been three market cycles in stocks over the past 100 years and two in bonds. Currently, the return to stocks is in an uptrend that began in 2009 while bonds are trading in a downtrend that began in 1991. Both of these trends should reverse soon, but the 10-year ERP will probably remain positive for the rest of the decade because it will take time for these two trends to once again converge.

Figure 3. United States 10-year Equity Risk Premium, 1792 to 2019
The 10-year average of the equity risk premium in the United States over the past 200 years is illustrated in Figure 3. Volatility in the equity premium is driven more by changes in the return to stocks than changes in the return to bonds.
If you compare the Equity Risk Premium in the 1800s with the 1900s you will see a dramatic difference in the ERP. During the 1800s, there were more frequent and longer periods when the ERP was negative than in the 1900s. In fact, the ERP was negative the majority of the time before the 1850s when banks and insurance companies dominated American stock markets.
Government bonds were safer than equities during the first half of the nineteenth century. When railroads exploded onto the scene in the 1840s and represented the majority of stock market capitalization for the rest of the century, this changed. After the civil war, bond yields declined, and stock returns rose returning the ERP to positive territory for most of the second half of the 1800s.
During the 1900s, it was only during periods of recession that the ERP turned negative, mainly due to the poor performance of stocks. This occurred in the early 1920s in the post-World War I recession, during the Great Depression in the 1930s, during the energy crisis of the 1970s and during the Great Financial Crisis in the 2000s when the stock market twice declined over 50%.
Although stocks are riskier than bonds, there are 17 periods during the past 100 years when the equity-risk premium was negative meaning that bonds outperformed stocks over a 10-year period. The equity-risk premium has been negative in 59 of the past 221 years meaning that bonds outperformed stocks 27% of the time. The worst return came in the decade between 1999 and 2009 when bonds beat stocks by 8.22% per annum. The highest equity premium was in 1959 when stocks beat bonds by 18.17%.
The UK Equity Risk Premium: The Effect of War, Peace and Bubbles
Figure 4 shows the equity-risk premium in the United Kingdom since 1700. Several things are immediately discernable. There were four periods in the 1700s when bonds outperformed stocks, the most dramatic period being between 1710 and 1720 (-7.62%) when the South Sea Bubble struck financial markets. By contrast, the highest ERP was in the 1760s when the United Kingdom was at peace, interest rates declined, and stock returns rose.
The ERP was mostly positive for the 150 years between the 1760s and 1920s with the exception of the decade that followed the end of the Napoleonic Wars. The yield on bonds remained high while the return to stocks declined. The 1800s were a century of peace in which money was freed up from government bonds to invest in railroads and other industries. By consistently outperforming bonds, equities attracted money away from British consols. There was a crowding-in effect as capital flowed to industry in the United Kingdom and the rest of the world. The result was steady growth as the global economy developed.

Figure 4. United Kingdom 10-year Equity Risk Premium, 1700 to 2023
The twentieth century was a roller coaster ride compared to the previous two centuries. The equity premium plunged from 4.66% in 1928 to -5.95% in 1938, rose to 16.33% in 1959, fell to -0.12% in 1982, shot up to 12.94% in 1985 and declined to -4.91% in 2008. By comparison, the 1800s had few dramatic swings in the equity-risk premium. The equity-risk premium rose to only 3% in the 1800s but ranged between 13% and 16.34% between 1949 and 1953.
Although the charts for the United Kingdom and the United States look quite different in the 1800s, they are very similar in the 1900s. Again, it is the post-World War I era of the 1920s when the ERP was negative in both countries. Rising bond yields during the post-war inflation, and thus lower bond prices, and declining returns to equities pushed the ERP into negative territory for ten years. This is a reminder that there can be long periods of time when stocks consistently underperform bonds. A positive ERP is not a given. The other primary period when the ERP was negative was the 2000s when bond yields were high, and the stock market faced two dramatic declines in 2000 and 2008 during the Great Financial Crisis.
The similarity in results for the United States and the United Kingdom since 1914 is striking. If we were to chart the ERP for other countries during the past 100 years, we would get similar results. The minimum and maximum dates of the ERP are similar. The ERP is driven by changes in equity returns more than bond returns and equity markets in the United States and the United Kingdom rose and fell at similar points in time. Obviously, financial markets are more integrated across international borders today than they were 200 years ago. Integration will only increase in the future.
Around the World with the ERP
Finally, we wanted to examine the ERP for the entire world. All values for stocks and bonds are converted to US Dollars. The United States and the United Kingdom have represented over half of global market capitalization during the past 300 years, so the results for the global ERP are similar to the data for the UK and USA. There is no world government bond, so we use the US government 10-year bond as a proxy for the risk-free bond. As Figure 5 shows, there are very few years in which the ERP was negative. The main periods were in the 1720s after the South Sea Bubble, during the Napoleonic Wars, during the 1820s, during the 1920s and around 2010. The highest returns came in the 1920s, 1940s and 1950s. The 2010s also provided one of the highest ERPs in history, though more because of low bond yields than high stock returns. Stocks do, on average, outperform bonds.

Figure 5. World 10-year Equity Risk Premium, 1710 to 2023
Winners and Losers
Table 1 looks at the ERP by decade in the United States, the United Kingdom, and the world over the past 200 years. The decades when the ERP was negative are marked in red. Over time, returns in the United States, the United Kingdom and the world have become more coordinated as financial markets have become more integrated. While decade returns differed in the 1800s, they lined up much better in the 1900s and 2000s. The 1930s and 2000s were the two decades when the ERP was negative in both countries and in the world. This shows that global integration of stock and bond markets has increased over time.
|
Decade |
United States |
United Kingdom |
World |
|
1789-1799 |
0.98 |
1.94 |
5.26 |
|
1799-1809 |
-0.68 |
2.82 |
-0.24 |
|
1809-1819 |
-4.54 |
0.45 |
-0.44 |
|
1819-1829 |
0.11 |
-3.16 |
-3.43 |
|
1829-1839 |
2.75 |
0.26 |
3.24 |
|
1839-1849 |
-2.14 |
-1.26 |
-0.04 |
|
1849-1859 |
1.01 |
3.65 |
2.11 |
|
1859-1869 |
4.59 |
2.77 |
3.39 |
|
1869-1879 |
2.62 |
3.52 |
2.99 |
|
1879-1889 |
0.42 |
3.22 |
2.46 |
|
1889-1899 |
5.68 |
2.29 |
3.09 |
|
1899-1909 |
8.88 |
1.47 |
4.09 |
|
1909-1919 |
5.44 |
8.66 |
8.45 |
|
1919-1929 |
6.81 |
0.18 |
6.23 |
|
1929-1939 |
-2.55 |
-3 |
-2.25 |
|
1939-1949 |
6.1 |
4.43 |
6.64 |
|
1949-1959 |
18.16 |
17.89 |
17.73 |
|
1959-1969 |
4.91 |
7.98 |
6.67 |
|
1969-1979 |
0.65 |
1.04 |
1.64 |
|
1979-1989 |
3.79 |
8.2 |
6.74 |
|
1989-1999 |
11.01 |
3.19 |
3.58 |
|
1999-2009 |
-8.21 |
-4.84 |
-5.93 |
|
2009-2019 |
8.91 |
2.75 |
5.83 |
|
2019-2022 |
12.23 |
11.3 |
12.25 |
Table 1. Equity Risk Premium in the United States, the United Kingdom and the World by Decade
Life in the 2020s
Current trends support the continuance of the equity premium remaining high in the United States, the United Kingdom, and the world during the rest of the decade. Data indicates that stocks beat bonds 80% of the time, and bonds outperform 20% of the time.
Rising bond yields in 2021 and 2022 caused losses to bonds increasing the Equity Risk Premium. The losses in 2021 and 2022 will ensure that the Equity Risk Premium will remain positive for the rest of the decade. Returns to bonds are likely to be around 4% during the next few years. Therefore, the equity premium will remain primarily dependent upon the return to stocks.
Historically, the equity risk premium has averaged around 3% for the United States and the United Kingdom. With bonds yielding 4% in the US and the UK, it would be difficult to expect equity returns to be much greater than 7% over the next ten years. On the other hand, the return to equities in the United States has been around 10% during the past decade. Investors have gotten used to high returns, but they will probably have to adjust to receiving lower returns on stocks and higher returns on bonds during the rest of the decade.
