I often crave donuts being the sugar lover that I am. And I am not alone here at Global Financial Data. On the way to the office there is a local Donut shop called Rose Donuts & Cafe, which has the best donuts as is depicted in Figure 1 — fluffy, fresh, overly large delights such as maple bars, cake donuts, sprinkles, chocolate glazed, old fashioned, Bavarian crème filled goodies, and cinnamon rolls so large you could quarter them and still be stuffed. So many flavors to choose from, French-croissants and fresh baked muffins.

Figure 1. Rose Donuts & Café, 624 Camino De Los Mares, San Clemente, CA 92673
So, I ask myself why is there still a Dunkin’ Donuts, across the street when Rose’s donuts taste so much better? I had to find out who owns the Dunkin chain because it must have some story behind it because they certainly don’t have good tasting donuts in my opinion. And quite a story there is.
Dunkin’ Donuts, Figure 2, as it is known today, was founded by William Rosenberg, a Jewish immigrant, who only completed the eighth grade. He was quickly forced to work at the age of 14 to help support his family when his father Nathan lost the family grocery store during the great depression and held many jobs during his teen years. After working for Western Union, as a full-time telegram delivery boy, Rosenberg began working for Simco, a company that distributed ice cream from refrigerated trucks. At Simco, he quickly rose through the company and by age 21, he was a manager supervising their production and manufacturing of nearly 100 trucks.

Figure 2. Example of Dunkin’ Donuts
Through his observation of human purchasing behavior over the course of his many jobs in the service industry, Rosenberg gained the knowledge necessary to start his own donut shop. However, Rosenberg did more than just that. He started an entire franchise and even adjusting for inflation – he did it with very little cash in 1940s.
After World War II, Rosenberg borrowed $1,000 and combined this with $1,500 (roughly $25,000 today) he had in war bonds to start his mobile catering service “Industrial Lunch Services” that delivered meals and offered coffee break services to factory workers outside of Boston, Massachusetts.
Rosenberg designed his own catering vehicle, as seen in Figure 3, that had custom-built stainless steel shelves that stocked snacks and sandwiches which were basically a prototype for the current mobile catering vans still used today. Rosenberg’s focus was on making the customer happy through options and choice as his trucks clearly displayed the items for customers to make their own selection. Shortly, thereafter, Rosenberg had over 200 catering trucks, 25 in-plant outlets and a vending operation that delivered food to factory workers. Through continued observation, while serving food at construction sites and factories, where that donuts and coffee were the top picks of the daily visitors who were often in a hurry, Rosenberg’s knowledge grew as he continued to study the human experience.

Figure 3. Industrial Lunch Services Catering Truck
Shortly thereafter, he decided to open a store that specialized in coffee and donuts after he determined that 40% of his revenues came from coffee and donuts and wanted to offer 52 varieties of donuts since traditional donut shops offered only five different varieties. On Memorial Day in 1948 in Quincy, Massachusetts, Rosenberg founded Open Kettle Donuts, changed its name to Kettle Donuts, and then to Dunkin’ Donuts in 1950.
Early on Rosenberg began laying an excellent foundation of marketing concepts for Dunkin’ Donuts beginning with an ideal name for his business combining the coffee and donuts theme from his previous personal experience. He laid the foundation for the brand even before it began through his keen sense of human need and Rosenberg coined the phrase “The Customer is Boss.” His initial brand foundation was off to a great start and within five years, others began expressing a franchise interest. Rosenberg continued to grow the franchise chain to 100 locations in 1963, when he turned the day to day operations over to his son.
In 1990, with more 1000 stores, British beverage conglomerate, Allied Domecq purchased the thriving Dunkin’ Brands fast food restaurant chain. Figure 4 shows the performance of Dunkin’ Donuts between 1968 and 1990 when the company was bought out at $43.75 per share. The company underperformed the S&P 500 in the 1970s, but during the 1980s, it hit its stride and the stock price rose dramatically. The company had stock splits in 1981, 1983 and 1985. The company’s revenues more than doubled and the stock price rose over tenfold. You can see why Allied Domecq felt they had made a good investment. I have also included the fundamentals for your review. These can be seen in Figure 5.
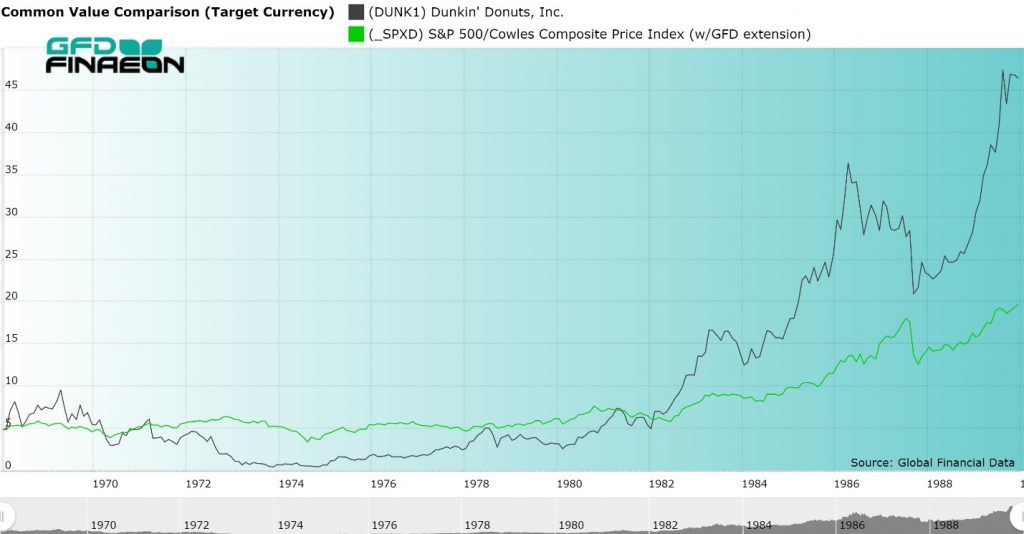
Figure 4. Dunkin’ Donuts, Inc. vs. S&P 500, 1968 to 1990
FUNDAMENTALS OF DUNKIN’ DONUTS 1968-1989
| Date | Net Sales ($ Million) | Shareholder’s Equity | Price To Sales | Price To Cash Flow |
| 10/31/1968 | 14.352 | 5.1 | 6.28 | 81.67 |
| 10/31/1969 | 14.229 | 6.7 | 3.07 | 29.01 |
| 10/31/1970 | 17.578 | 8.2 | 1.77 | 17.50 |
| 10/31/1971 | 19.2024 | 9.3 | 1.33 | 24.55 |
| 10/31/1972 | 23.4498 | 12.3 | 0.64 | 12.97 |
| 10/31/1973 | 24.9546 | 10.5 | 0.15 | -2.40 |
| 10/31/1974 | 27.4 | 11.8 | 0.14 | 6.70 |
| 10/31/1975 | 34.5 | 13.3 | 0.29 | 12.03 |
| 10/31/1976 | 43.3 | 16.1 | 0.30 | 11.93 |
| 10/31/1977 | 51.8 | 18.9 | 0.38 | 14.93 |
| 10/31/1978 | 57.1 | 22.3 | 0.50 | 7.94 |
| 10/31/1979 | 63.2 | 23.5 | 0.37 | 5.75 |
| 10/31/1980 | 63.5 | 27.1 | 0.49 | 6.70 |
| 10/31/1981 | 66.331 | 27.148 | 1.64 | 4.92 |
| 10/31/1982 | 64.918 | 31.802 | 1.23 | 8.24 |
| 10/31/1983 | 71.318 | 38.104 | 1.51 | 9.90 |
| 10/31/1984 | 77.495 | 44.994 | 1.44 | 8.93 |
| 10/31/1985 | 85.45 | 53.028 | 1.92 | 11.40 |
| 10/31/1986 | 94.391 | 62.158 | 2.31 | 13.22 |
| 10/31/1987 | 101.037 | 72.603 | 1.65 | 9.91 |
| 10/31/1988 | 102.714 | 68.219 | 1.68 | 8.65 |
| 10/31/1989 | 109.336 | 72.653 | 2.46 | 12.48 |
|
Figure 5. Dunkin’ Donuts Fundamentals, 1968 to 1989 |
Fifteen years later, in July 2005, Allied Domecq was acquired by their parent company, Pernod Ricard SA. Pernod knew quickly that they needed to alleviate debt, so the French beverage company began searching for a buyer for this segment of their product line.
In December 2005, Pernod Ricard SA, sold Dunkin’ Brands, to three private equity groups: Thomas H. Lee Partners, the Carlyle Group and Bain Capital for $2.43 billion. Thomas H. Lee, Carlyle Group and Bain all had vast fast food experience. Each had an equal share in Dunkin’, each desired to be partners, and each wanted to work with the existing Dunkin’ management team and CEO Ron Luther. Their combined goal was to take the chain to the next level. Their plans were aggressive seeking expansion to the west, to offer additional franchises, branch into more coffee beverages, offer higher-end, glamorous coffee drinks that would compete with Starbucks. The results are can be seen in Figure 6.
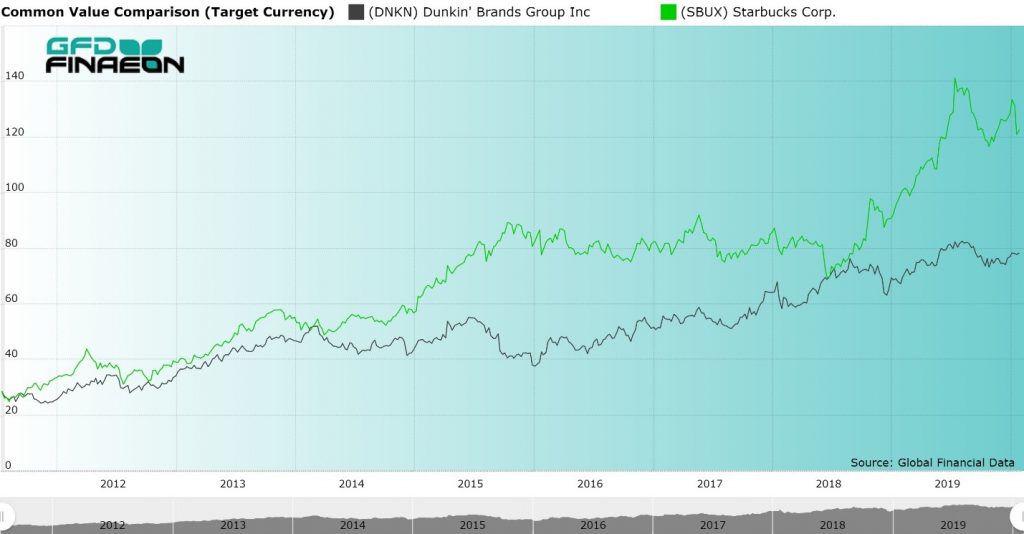
Figure 6. Dunkin’ Brands Inc. (Black) vs. Starbucks Inc. (Green), 2011 to 2020
Five years later with a thriving business, T.H Lee, Carlyle Group, and Bain Capital applied for an I.P.O. and the company went public in 2011. The company had 97 million shares outstanding making the company worth $2.7 billion when it IPO’d on July 27, 2011, providing the three private equity groups, each with a 10% return, over their cost of buying the company in 2005.
During the past eight years, as Figure 7 shows, Dunkin’ Brands has outperformed the S&P 500. The company is now worth over $6.5 billion, providing a 13% annual return to anyone who invested in the IPO in 2011. Today DNKN trades on the Nasdaq and consistently shows rising sales, profits and the number of its locations. Due to Rosenberg’s brilliant observations and his ability to respond to consumer needs, he was able to build his business.
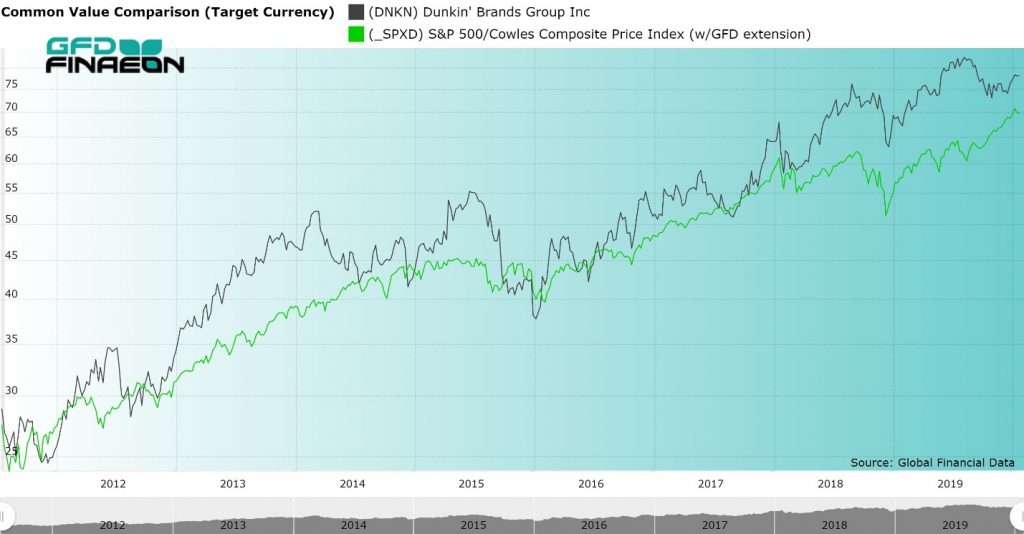
Figure 7. Dunkin’ Brands Group (Black) vs. S&P 500 (Green), 2011 to 2020
Dunkin’ Brands currently includes the Dunkin’ Donuts chain, Baskin-Robbins ice cream parlors and Togo’s sandwich stores. In the United States and the rest of the world, the growth of Dunkin’ Donuts has been strong. Today, Dunkin’ Donuts offers a mind-boggling mix of over 15,000 varieties of coffee. This includes Turbo Shots, Espresso, Iced Coffee, sugar free, with or without cream, low-calorie options, and dozens of other variations of the world’s favorite beverage, coffee! Some of the flavors you can get include Butter Pecan Swirl, Caramel, Cookie Dough, White Chocolate Raspberry and Rocky Road swirl.
I hadn’t even heard of all these flavors of coffee before. Had you? I think that I’m going to check out Dunkin’ Donuts later this week.
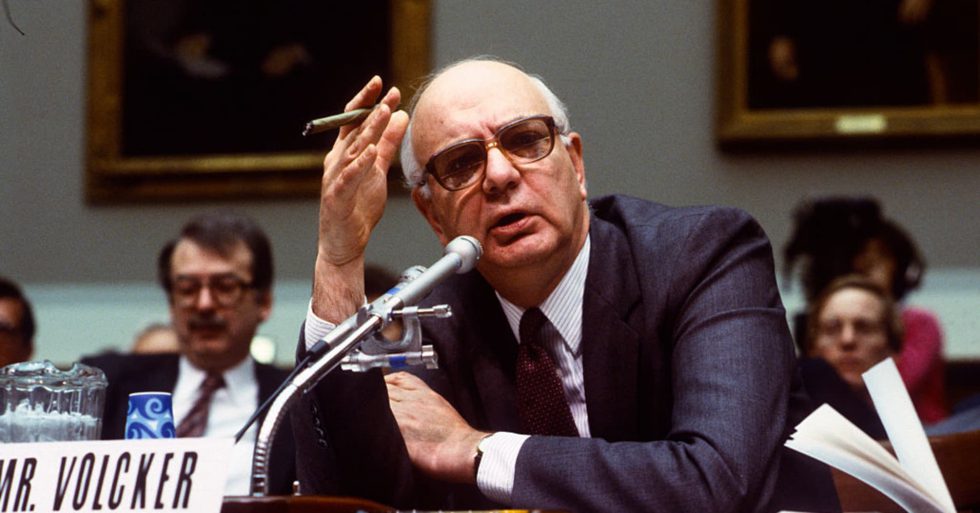
On December 9, Paul Volcker, who served as Chairman of the Federal Reserve Bank from 1979 to 1987, died at the age of 92. Paul Volcker changed the shape of the economy and of financial markets.
The Rise and Fall of Interest Rates
Paul Volcker is known for two things. He instituted the Volcker Rule as part of the Dodd-Frank Wall Street Reform and Consumer Protection Act. This prohibited banks from conducting some investment activities with their own accounts and limited their dealings with hedge funds and private equity funds.
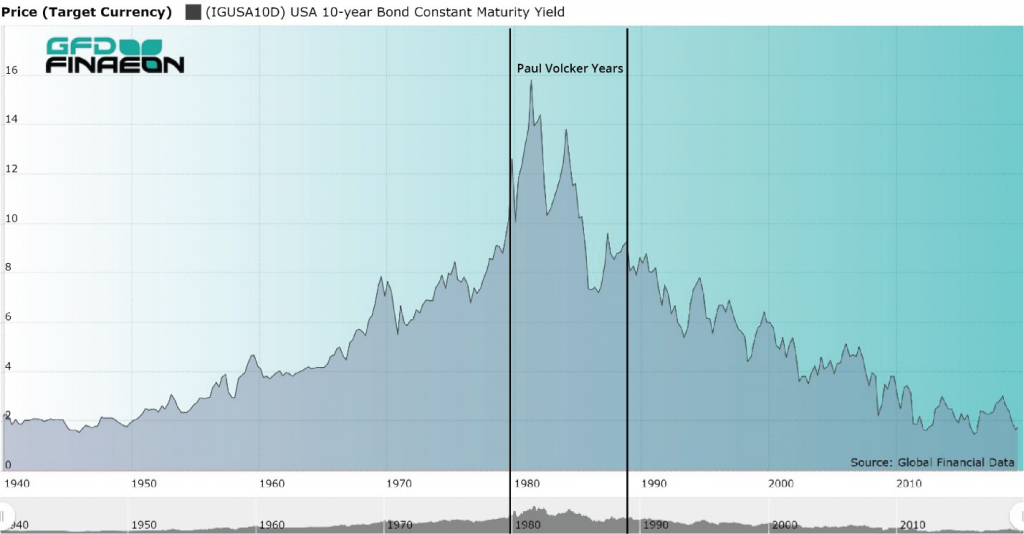
Figure 1. USA 10-year Government Bond Yield, 1940 to 2019
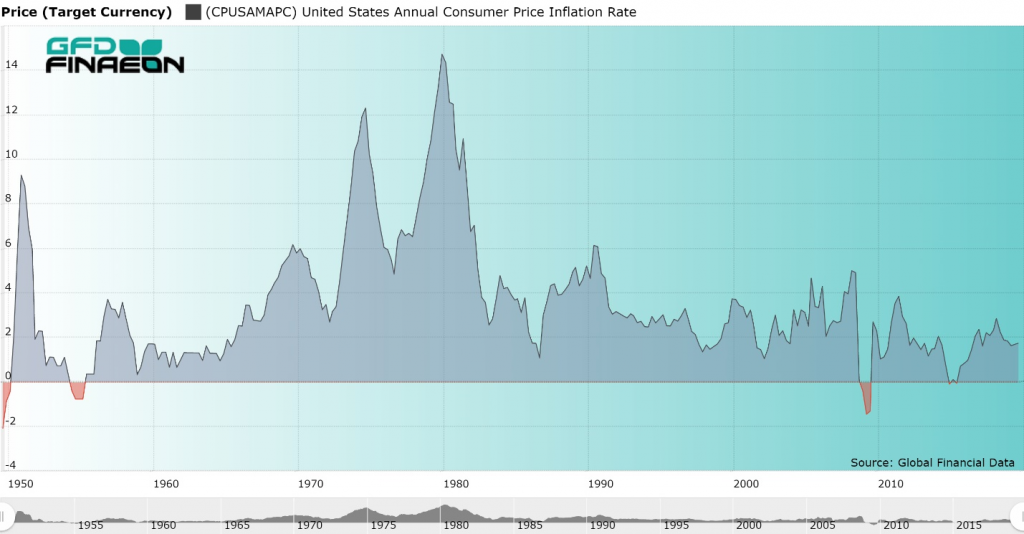
Figure 2. United States Inflation Rate, 1950 to 2019
Second, Paul Volcker defeated the rising inflation and interest rates of the 1970s. In 1981, the yield on the 10-year bond peaked at 15.84% as can be seen in Figure 1. Today, the bond yield and inflation are both below 2% as depicted in Figures 1 and 2. Government bond yields in most of the Euro zone are negative in nominal terms and are negative in real terms in the United States. There is no sign that bond yields, interest rates or inflation will reverse and begin rising in the near future. If anything, bond yields are likely to continue to decline in the United States.
Paul Volcker Reverses 40 Years of Rising Rates
Paul Volcker instituted major changes that impacted investors. Between 1792 and 1941, stocks provided a 6.80% return while bonds provided a 4.99% return. Then the great Keynesian inflation began. Between 1941 and 1981, US equities returned 11.38% while the 10-year bond returned only 2.75% as can be seen in Figure 3. Inflation averaged 4.60% during those 40 years meaning that after inflation bond investors actually lost money as is illustrated in Figure 4.
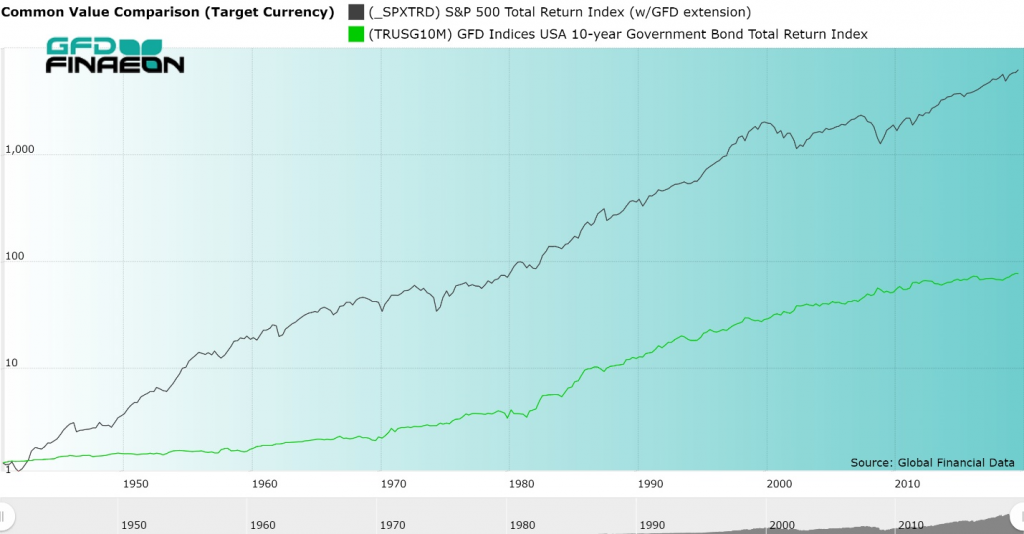
Figure 3. S&P 500 Composite Total Return and Government Bond Total Returns, 1940 to 2019
However, between 1981 and 2018, stocks returned 11.13% and bonds returned 8.04%. This is illustrated in Figure 4. Bonds made no progress from 1940 to 1981, then provided dramatic returns from 1981 to 2019. The cause of this change was Paul Volcker. Although there was little difference in the annual return to equities, the return to bonds rose significantly as the decline in bond yields produced capital gains rewarding bond investors.
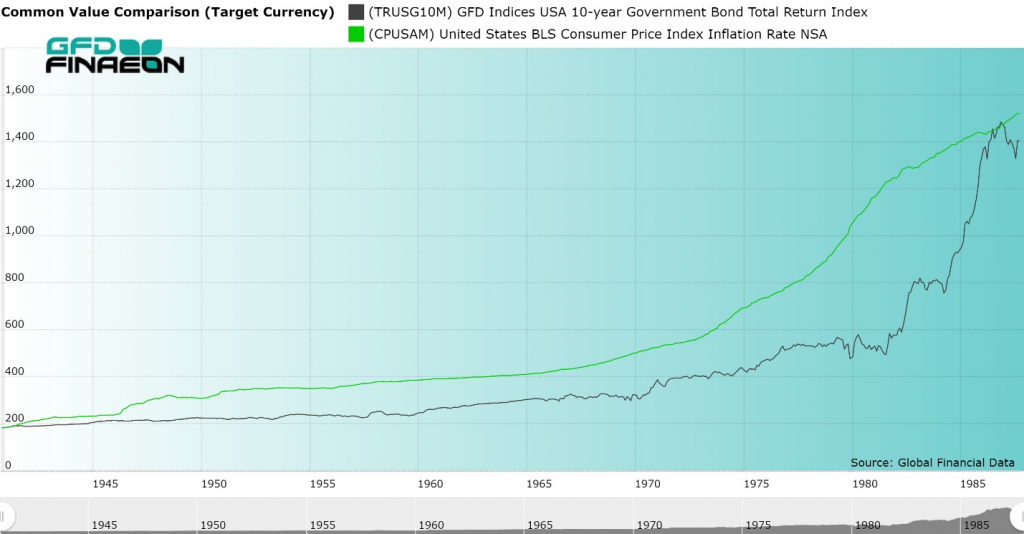
Figure 4. United States Government Bond Return Index and Consumer Prices, 1941 to 1987
The years between 1941 and 1981 were atypical of American financial history. The equity risk premium rose from 1.72% between 1792 to 1941 to 8.40% between 1941 and 1981. As equity markets recovered after World War II, bond investors were punished with rising bond yields, and many investors falsely interpreted the high returns as the standard for the equity risk premium.
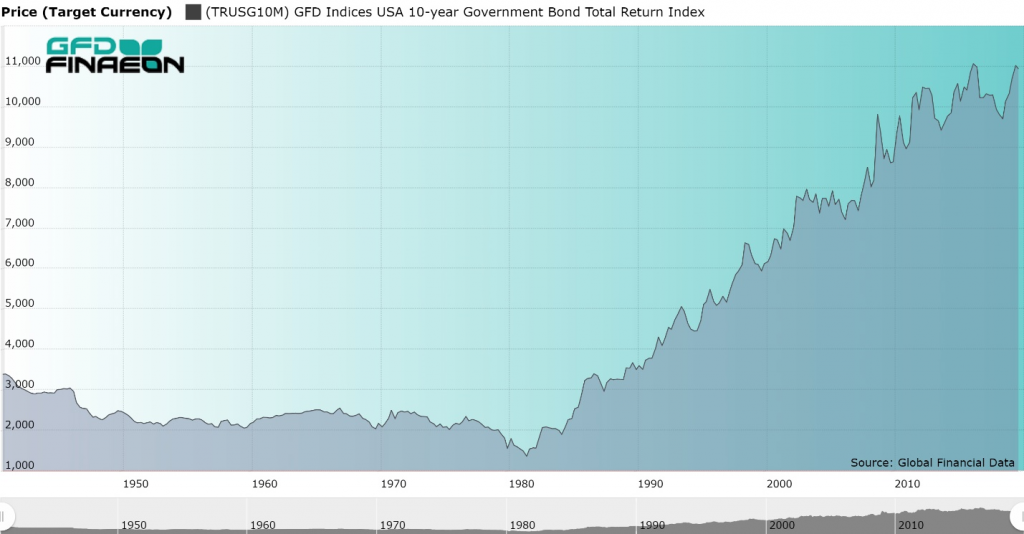
Figure 5. U.S. Government Bond Returns Adjusted for Inflation, 1940 to 2019
The Death of the Equity Risk Premium
Investors began to expect high returns on stocks; however, between 1981 and 2018, the equity risk premium fell back to 2.75%. This is illustrated in Figure 6. In some countries, such as Canada, government bonds have beaten the stock market since 1981. Most people believe that the equity risk premium is around 6% or even more when historically, except for the period between 1941 and 1981, the equity risk premium has been around 3%. Although bond yields may still decline in the next few years, the room for decline is minimal.
The 2020s have begun. During the 2010s, the fixed-income market has done things no one would have predicted when the 2010s began ten years ago. The most important feature of the past decade has been the steady decline in government bond yields, falling to negative nominal yields in most of Europe and negative real yields in the United States and Canada.
Government bond yields have been declining since 1981 throughout the world. In the United States, the 10-year bond yield was 3.85% at the end of 2009, but has declined to under 1.90% today. The yield on 10-year government bonds in Japan has declined from 1.30% in 2009 to -0.06% in 2019 while German bond yields have declined from 3.37% to -0.30%. Across the world, interest rates are negative in real terms. In Switzerland, even the 50-year bond has a negative return.
I believe that interest rates cannot continue to decline. Why accept a negative return when you can always hold cash with a zero return? There are transaction costs of buying and selling bonds. Although these costs can be easily factored into a long-term bond, this is more difficult with a short-term bond. Will the 38-year bull market in bonds driven by declining yields come to an end? Is a new multi-decade pattern of rising bond yields replacing the declining yields of the past few decades? There are over $10 trillion in outstanding government bonds with negative yields in the world. Many of these bonds are owned by governments so the yield is almost irrelevant. Will bond yields still be negative ten years from now? Will interest rates decline or rise during the decade to come?
The Interest Rate Pyramid
We are currently in a 75-year cycle of rising and falling interest rates. The government controlled interest rates during World War II to limit the government’s cost of funding the debt it issued to pay for the war. When the war was over, the government allowed the market to once again determine bond yields, and the government’s policies fed inflation driving prices and bond yields up between 1945 and 1981. Paul Volker decided to fight inflation at any cost and reversed the pattern of rising inflation and interest rates. Inflation and bond yields have declined since 1981 falling from 15.81% in 1981 to under 2% today.
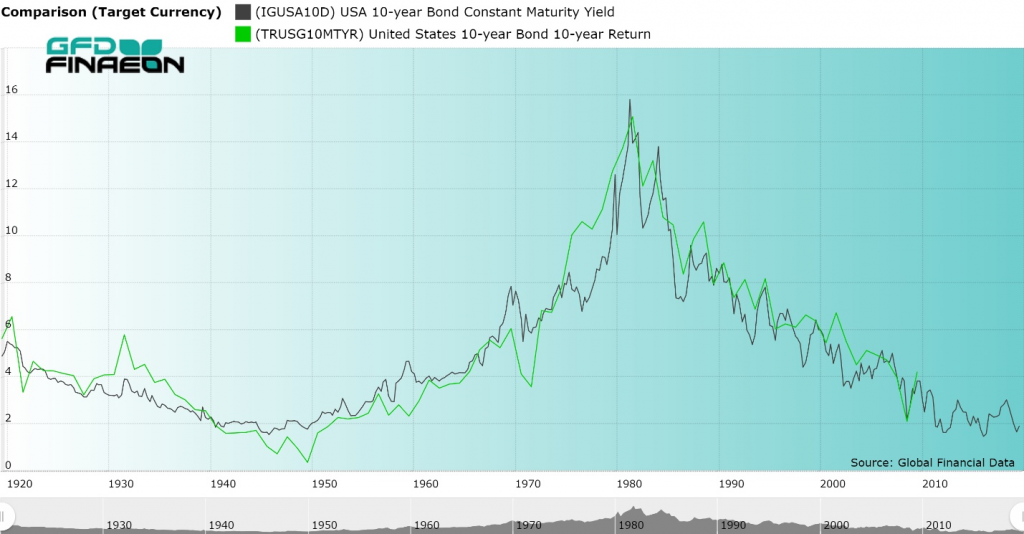
Figure 1. United States 10-year Government Bond Yield and Return, 1919 to 2019
Fixed-income investors are concerned about two factors, the capital gain or loss they receive when there is a change in the bond yield and the interest payments they receive each six months from the government. GFD’s 10-year Total Return Government Bond index takes both of these factors into consideration in calculating the total return to holders of government bonds. During the period of rising interest rates between 1945 and 1981, bondholders received higher interest payments over time, but lost money as higher interest rates drove the price of bonds down. The opposite effect has occurred since 1981.
What is interesting is that the capital gain/loss that occurs because of rising or falling bond yields offsets the interest bondholders receive to even out the return to investors. The assumption is that as the bondholder receives interest payments over time, this money is reinvested in government bonds at the current yield in the market. In theory, the bondholder could completely reinvest his principal and interest in a new bond each year. Bondholders can also invest in mutual funds that effectively do this for them. The interesting thing is that over the past 75 years, the capital gain/loss that has been generated by the rising and falling bond yields has offset the rising and falling coupons that have occurred over time.
Figure 1 compares the yield on the US 10-year bond in black with the total return to an index of bonds invested in 10-year government bonds in green. The return index compares the return to government bond holders between 2008 and 2018 with the yield to government bonds in 2008. Of course, you would have needed to wait until 2018 to find out what the return was to investors in government bonds in 2008, but as Figure 1 shows, the correlation between the yield on government bonds at any point in time and the actual return investors receive over the next ten years is uncanny. The fact that this pattern has persisted for the past 100 years is amazing.
Examining other countries, you get similar results. Figure 2 shows the relationship between bond yields and returns for Japan and Figure 3 shows the relationship for France. The relationship between bond yields and returns is not always as strong as it is in the United States, but the general relationship still exists.
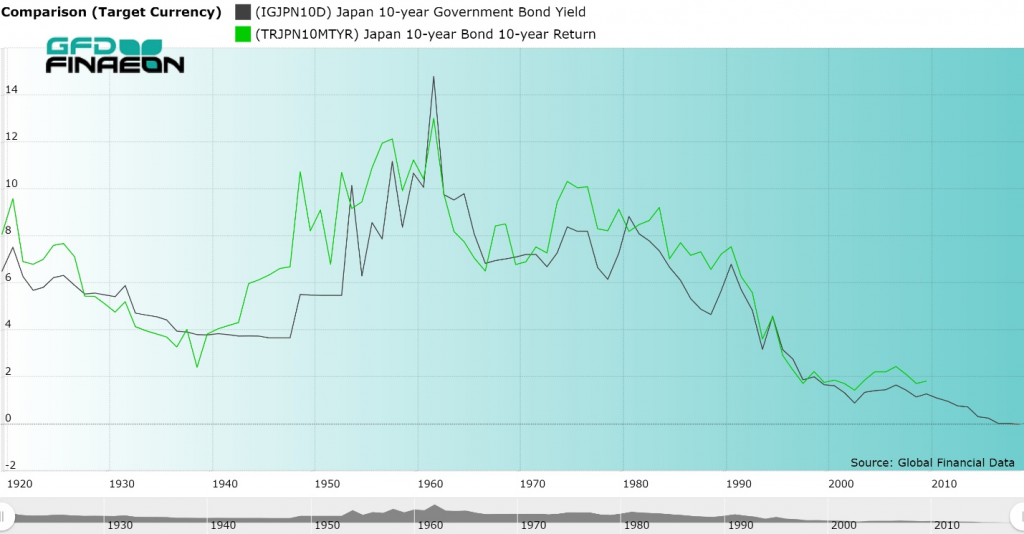
Figure 2. Japan 10-year Government Bond Yield and Return, 1919 to 2019
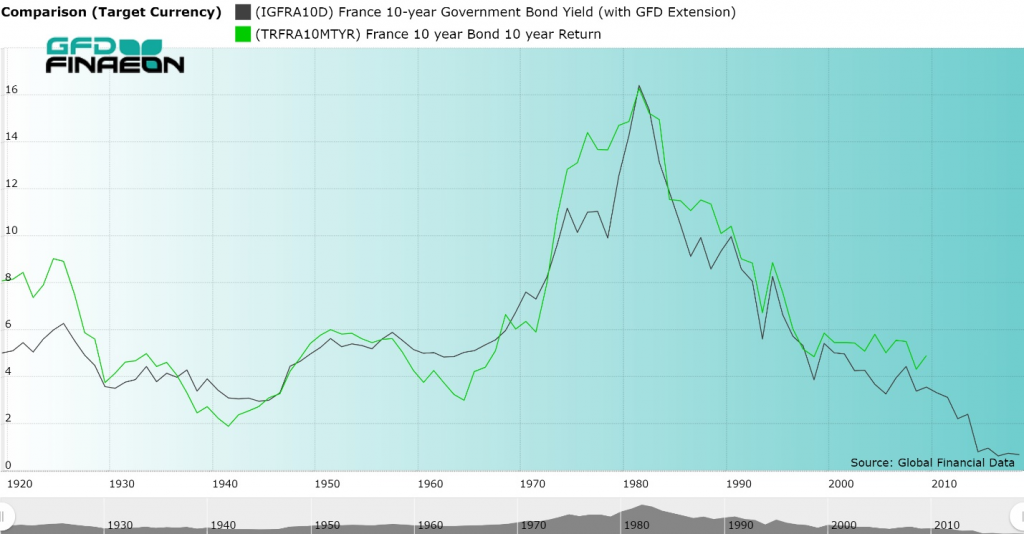
Figure 3. France 10-year Government Bond Yield and Return, 1919 to 2019
The Decade to Come
Examination of global bond yields in Figure 4 compares bond yields over the past 20 years in the United States, Germany, the United Kingdom, Japan, Canada, Australia and Switzerland. Interest rates in Germany, Japan and Switzerland have turned negative, and after adjusting for inflation, you would find that real yields in the remaining countries are negative.
If you look at the yield and return graphs for the United States, Japan and France in Figures 1, 2 and 3, you will see that the returns are not provided after 2009 because we don’t know what the behavior of bonds in the 2020s will be and thus cannot calculate the total return to bondholders between 2012 and 2022, for example, because this number will not be known until 2022.
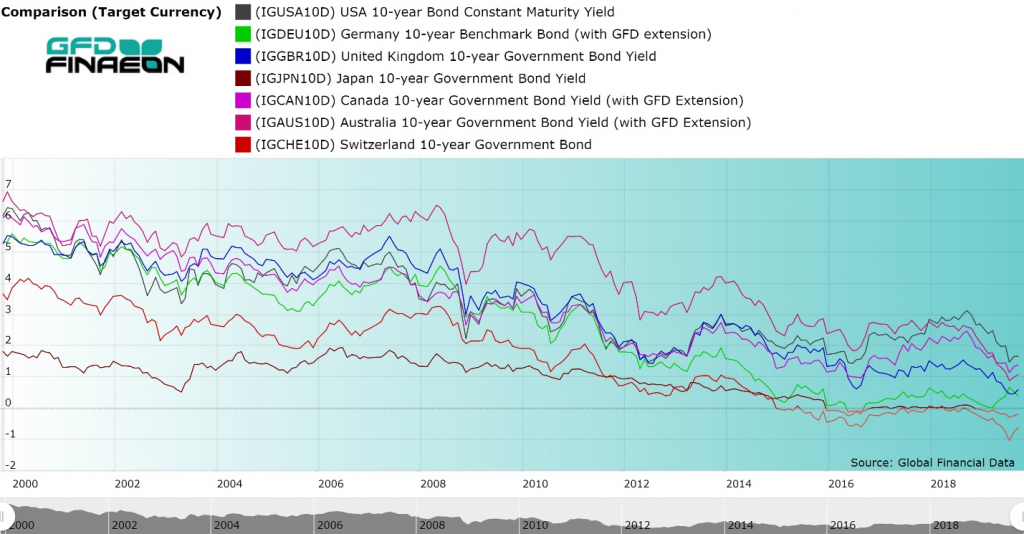
Figure 4. 10-Year Government Bond Yields for Seven Countries, 2000 to 2019
The inevitable logic that would come from this analysis so far is that if the yield on government bonds declined in the 2010s as they did in the 1980s, 1990s and 2000s, then a continued decline in government bond yields during the next decade is the most logical outcome. If bond yields were to rise, this would impose capital losses on bondholders, driving the total return to negative levels even below the yields that persisted in the 2010s.
To illustrate this fact, I have calculated what the total return to US government bondholders would be if bond yields rose by 0.125% in each of the next ten years and if they fell by 0.125% annually starting at a yield of 2% at the end of 2019. With these assumptions, I can calculate both the return from interest payments and the impact on the price of government bonds as the money was reinvested. I provide the results in Figure 5. In reality, bond yields will not rise or fall each year at a constant rate, but will fluctuate. The overall results will be the same regardless.
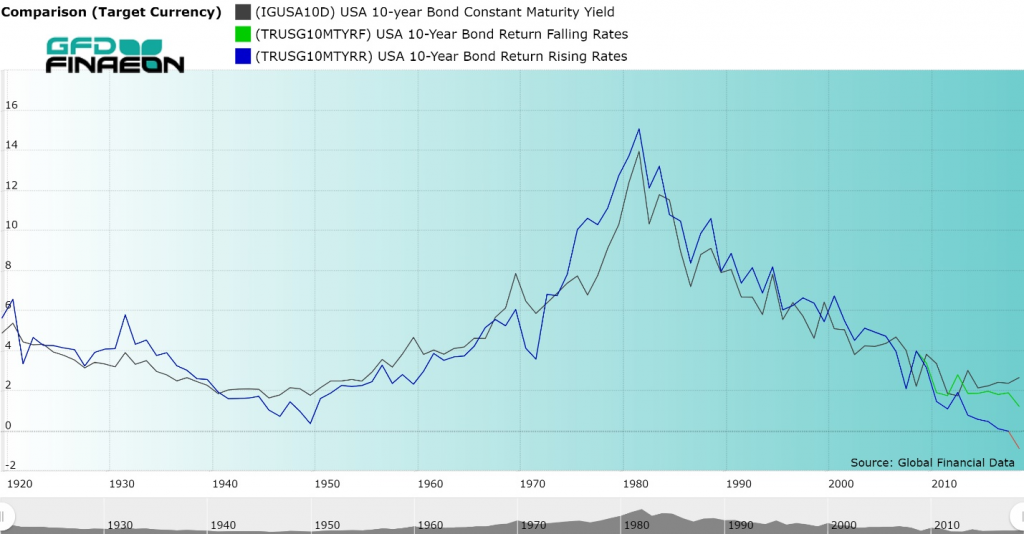
Figure 5. United States 10-year Government Bond Rising and Falling Yields and Returns
The black line in Figure 5 shows the path of government bond yields through 2019. The green line shows the returns that would occur if interest rates fell by 0.125% each year for the next 10 years, and the blue line shows what would happen if interest rates rose by 0.125% each year for the next 10 years. The cumulative effect of rising interest rates would be to generate negative returns to bondholders from 2019 by 2029. On the other hand, if government bond yields continue to fall, the decline in the total return is reduced by the capital gain shareholders would receive allowing returns to follow more closely to the bond yields that existed in the 2010s. Since the green line of falling interest rates adheres more closely to the actual behavior of interest rates between 2009 and 2019, it would seem more logical to predict falling interest rates over the course of the 2020s than rising interest rates.
Trouble in Bond Paradise
Whether you expect bond yields to rise or fall over the next 10 years, the conclusions reached in this paper should raise concerns for any fixed-income investor. If government bond yields rise over the next 10 years, by the end of the decade, if not earlier, fixed-income investors will receive a negative return on their investment. On the other hand, the only way for fixed-income investors to avoid negative returns is to hope for falling bond yields. Rising bond prices will offset the decline in yields, but at the same time may only delay the inevitable losses that fixed-income investors will eventually have to incur when interest rates rise at some point in the future.
What is true of the United States is true of the rest of the world. As Figure 4 indicates, 10-year government bond yields are lower than they are in the United States in virtually every developed country in the world. There is currently over $10 trillion in notes and bonds with a negative yield. If bond yields don’t rise, investors will receive a negative return because of rising bond prices. If bond yields do rise, investors will receive a negative return because of rising bond prices.
Some would say that a return to rising bond yields is inevitable, but this isn’t necessarily true. Bond yields fell throughout the 1800s. Yields fell from 5.345% in 1803 to 2.43% in 1897. There is no reason why bond yields might not fall for decades if the Federal Reserve can keep inflation under control. Population growth and economic growth may remain stagnant and constrain any increase in inflation or interest rates in the future. Data on these indicators are available through the GFDatabase and GFD Indices. All of the 10-year bond yields extend further back than is displayed in Figure 4. Fixed-income investors may be condemned to lose money during the next decade. The only question is how much?

Global Financial Data has added over 600 files to its database that provide data on government revenues, government expenditures, the primary balance, interest paid on public debt and the amount of outstanding government debt as a share of GDP. The data cover 56 countries on government revenues, expenditures and interest expense and 200 countries on outstanding government debt.
GFD has combined its extensive database of historical data on government revenues, expenditures and debt with the recent work of Ayhan, Kurlat, Ohnsorge and Sugawara in their paper, “A Cross-Country Database of Fiscal Space” and of Mauro, Romeu, Binder and Zaman in their paper, “A Modern History of Fiscal Prudence and Profligacy” to produce an extensive database that enables users to measure government revenues, expenditures, debt and interest expense relative to GDP beginning in 1688 in the United Kingdom, 1792 in the United States and the 1800s in other major countries. This data has been updated through 2018 where possible.
Ayhan, Kurlat, Ohnsorge and Sugawara have produced a database that measures the Government Debt/GDP Ratio for 200 countries from 1990 until 2018. We have combined their research with GFD’s data on over 30 countries to provide long-term data series that provide insights into how the Government Revenues and Expenditures/GDP and Debt/GDP ratios have changed over time.
In addition to government debt, GFD has added data from the OECD on private debt that begins in 1995 and GFD has summed the private and public debt to provide total debt data for 31 countries that are members of the OECD that provide this data. This data is also expressed as a percentage of GDP.
GFD has created simple mnemonics that enable users to look up data on the different countries that include this data in the GFDatabase. How the codes were created for each of the six variables is provided in Table 1. For example, to obtain the code for Government Revenues as a share of GDP for the United States, simply add GVRP to the ISO Code for the United States, which is USA, to get GVRPUSA. For the Government Gross Debt as a Percentage of GDP for Japan, add GVDP to JPN and get GVDPJPN.
Government Revenues as % of GDP GVRP + ISO GVRPUSA
Government Expenditures as % of GDP GVXP + ISO GVRXUSA
Government Primary Expenditures as % of GDP GVPXP + ISO GVPXPUSA
Interest Paid on Public Debt as % of GDP GVIP + ISO GVIPUSA
Government Primary Balance as % of GDP GVBP + ISO GVBPISO
Government Gross Public Debt as % of GDP GVDP + ISO GVDPUSA
Private Outstanding Debt as a % of GDP PRVD + ISO PRVDUSA
Private and Public Debt as a % of GDP PPUD + ISO PPUDUSA
Table 1. Mnemonics for Government Revenues, Expenditures and Debt in the GFDatabase
Subscribers can do a thorough analysis of government revenues, expenditures and debt using these data series. By calculating each of these variables as a percentage of GDP, the series automatically adjust for inflation and growth in the economy to see how each has changed over time. Not surprisingly, all have grown steadily since the 1800s.
It is important to analyze the Debt/GDP ratio for two reasons. First, excessive debt can constrain growth in the economy. Reinhart and Rogoff have alleged that when the government debt/GDP ratio exceeds 90% that countries will suffer from lower growth than would otherwise have occurred. Second, if you combine high interest rates with a high government debt load, this reduces the level of services which the government is able to provide because government spending is absorbed by interest costs. Interest Paid on Public Debt as a Percentage of GDP enables you to see when this ratio got too high and forced governments to reorganize their finances.
However, it is important to recognize the relationship between capital available for debt and capital available for the stock market. These two factors often display an inverse relationship as is illustrated in Figure 1. When the government is fighting a war, the government directs capital toward the bonds that are issued to pay for the war and away from the stock market. Once the war is over, capital is freed up and can be redirected to new industries and help the stock market to grow. Stock markets have seen some of their most rapid growth and largest bubbles during periods after wars when capital is released from government debt and the capital flows into the stock market.
Figure 1 provides a fascinating chart that compares the ratios of Federal Government Debt to GDP with Capitalization of the US Stock Market relative to GDP. The increases in government debt that occurred during the Civil War, World War I and World War II are clearly visible, as is the increase in debt that has occurred since 1980. You can contrast the changes in government debt with changes in the capitalization of the US stock market. During the 1900s, there was often an inverse correlation between government debt and stock market capitalization with debt increasing at the expense of the stock market during World War I and World War II. As government debt declined after World Wars I and II, stock market capitalization rose. Since 1980, however, both government debt and stock market capitalization have increased their share of GDP.
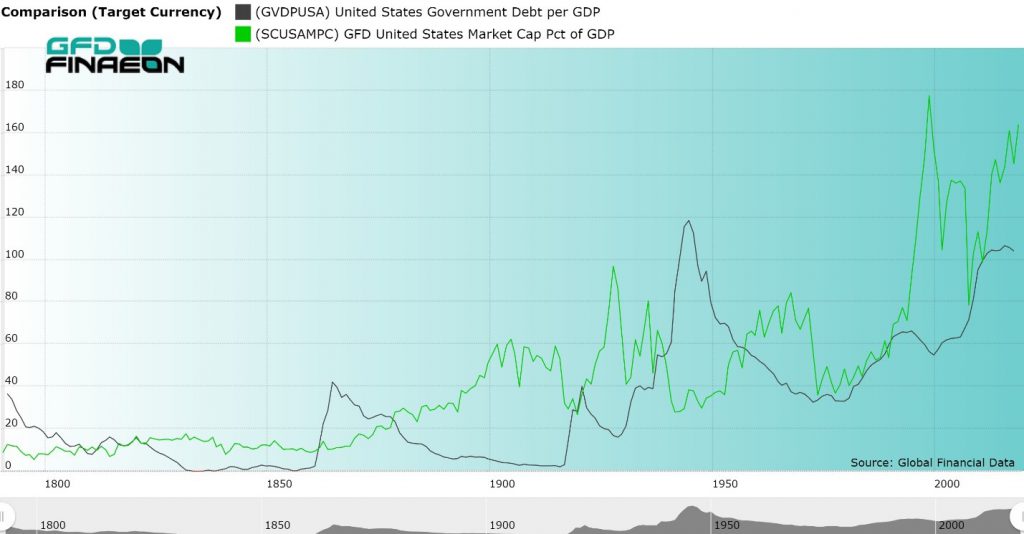
Figure 1. USA Federal Government Debt and Stock Market Capitalization to GDP, 1792 to 2018
An even more fascinating picture is provided in Figure 2 which looks at the United Kingdom. There was clearly an inverse correlation between government debt and the stock market between 1688 and the 1980s. Both debt and stock market capitalization increased between 1688 and 1720 when the South Sea Bubble occurred. Between 1720 and 1820, central government debt rose while the stock market stagnated. Between 1820 and 1914, government debt plummeted while the stock market increased to over 150% of GDP. During the next 40 years, the stock market shrank in size while government debt grew between 1914 and 1945, then declined over the next 40 years. Since the 1980s, both government debt and stock market capitalization have increased in the United Kingdom as has occurred in the United States and other countries.
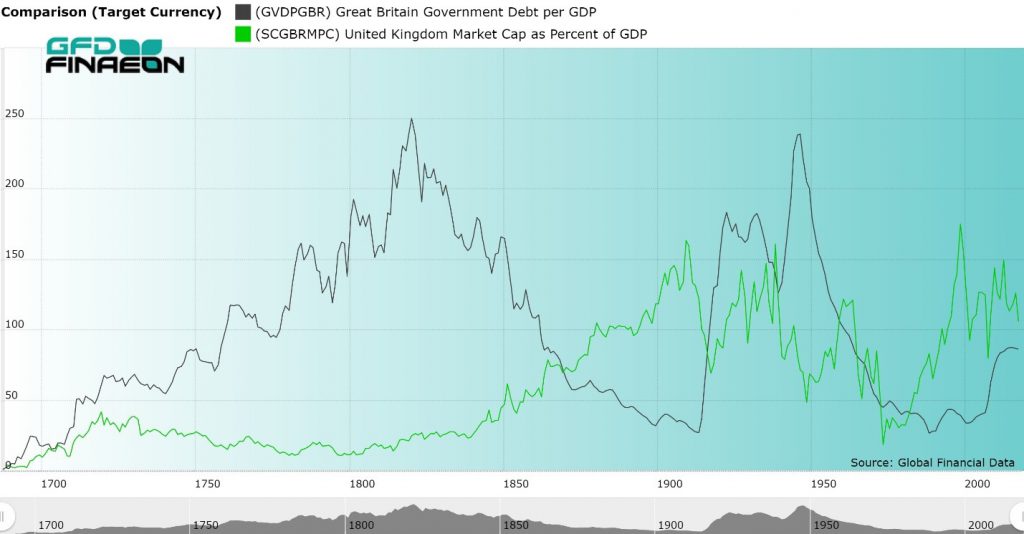
Figure 2. United Kingdom Government Debt and Stock Market Capitalization to GDP, 1688 to 2018
The addition of these series on government revenues, expenditures and debt will provide subscribers with a greater ability to understand the interaction between different financial markets. Using the graphs of the United States and United Kingdom, it appears that today money is flowing into both debt and the stock market simultaneously. Similar patterns exist in other countries. How long this will continue before this trend reverses remains to be seen.
