Global Financial Data has added over 600 files to its database that provide data on government revenues, government expenditures, the primary balance, interest paid on public debt and the amount of outstanding government debt as a share of GDP. The data cover 56 countries on government revenues, expenditures and interest expense and 200 countries on outstanding government debt.
GFD has combined its extensive database of historical data on government revenues, expenditures and debt with the recent work of Ayhan, Kurlat, Ohnsorge and Sugawara in their paper, “A Cross-Country Database of Fiscal Space” and of Mauro, Romeu, Binder and Zaman in their paper, “A Modern History of Fiscal Prudence and Profligacy” to produce an extensive database that enables users to measure government revenues, expenditures, debt and interest expense relative to GDP beginning in 1688 in the United Kingdom, 1792 in the United States and the 1800s in other major countries. This data has been updated through 2018 where possible.
Ayhan, Kurlat, Ohnsorge and Sugawara have produced a database that measures the Government Debt/GDP Ratio for 200 countries from 1990 until 2018. We have combined their research with GFD’s data on over 30 countries to provide long-term data series that provide insights into how the Government Revenues and Expenditures/GDP and Debt/GDP ratios have changed over time.
In addition to government debt, GFD has added data from the OECD on private debt that begins in 1995 and GFD has summed the private and public debt to provide total debt data for 31 countries that are members of the OECD that provide this data. This data is also expressed as a percentage of GDP.
GFD has created simple mnemonics that enable users to look up data on the different countries that include this data in the GFDatabase. How the codes were created for each of the six variables is provided in Table 1. For example, to obtain the code for Government Revenues as a share of GDP for the United States, simply add GVRP to the ISO Code for the United States, which is USA, to get GVRPUSA. For the Government Gross Debt as a Percentage of GDP for Japan, add GVDP to JPN and get GVDPJPN.
Government Revenues as % of GDP GVRP + ISO GVRPUSA
Government Expenditures as % of GDP GVXP + ISO GVRXUSA
Government Primary Expenditures as % of GDP GVPXP + ISO GVPXPUSA
Interest Paid on Public Debt as % of GDP GVIP + ISO GVIPUSA
Government Primary Balance as % of GDP GVBP + ISO GVBPISO
Government Gross Public Debt as % of GDP GVDP + ISO GVDPUSA
Private Outstanding Debt as a % of GDP PRVD + ISO PRVDUSA
Private and Public Debt as a % of GDP PPUD + ISO PPUDUSA
Table 1. Mnemonics for Government Revenues, Expenditures and Debt in the GFDatabase
Subscribers can do a thorough analysis of government revenues, expenditures and debt using these data series. By calculating each of these variables as a percentage of GDP, the series automatically adjust for inflation and growth in the economy to see how each has changed over time. Not surprisingly, all have grown steadily since the 1800s.
It is important to analyze the Debt/GDP ratio for two reasons. First, excessive debt can constrain growth in the economy. Reinhart and Rogoff have alleged that when the government debt/GDP ratio exceeds 90% that countries will suffer from lower growth than would otherwise have occurred. Second, if you combine high interest rates with a high government debt load, this reduces the level of services which the government is able to provide because government spending is absorbed by interest costs. Interest Paid on Public Debt as a Percentage of GDP enables you to see when this ratio got too high and forced governments to reorganize their finances.
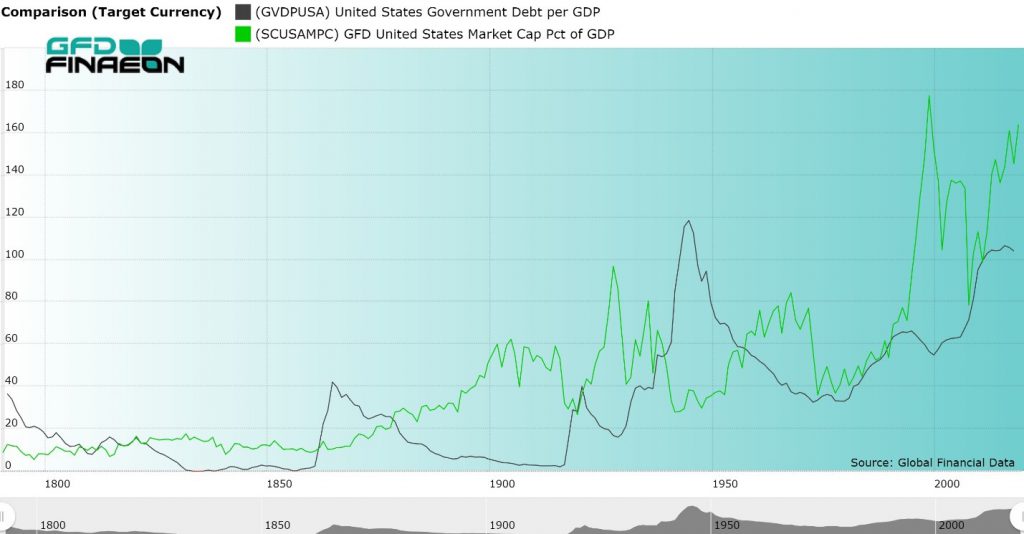
However, it is important to recognize the relationship between capital available for debt and capital available for the stock market. These two factors often display an inverse relationship as is illustrated in Figure 1. When the government is fighting a war, the government directs capital toward the bonds that are issued to pay for the war and away from the stock market. Once the war is over, capital is freed up and can be redirected to new industries and help the stock market to grow. Stock markets have seen some of their most rapid growth and largest bubbles during periods after wars when capital is released from government debt and the capital flows into the stock market.
Figure 1 provides a fascinating chart that compares the ratios of Federal Government Debt to GDP with Capitalization of the US Stock Market relative to GDP. The increases in government debt that occurred during the Civil War, World War I and World War II are clearly visible, as is the increase in debt that has occurred since 1980. You can contrast the changes in government debt with changes in the capitalization of the US stock market. During the 1900s, there was often an inverse correlation between government debt and stock market capitalization with debt increasing at the expense of the stock market during World War I and World War II. As government debt declined after World Wars I and II, stock market capitalization rose. Since 1980, however, both government debt and stock market capitalization have increased their share of GDP.

Figure 1. USA Federal Government Debt and Stock Market Capitalization to GDP, 1792 to 2018
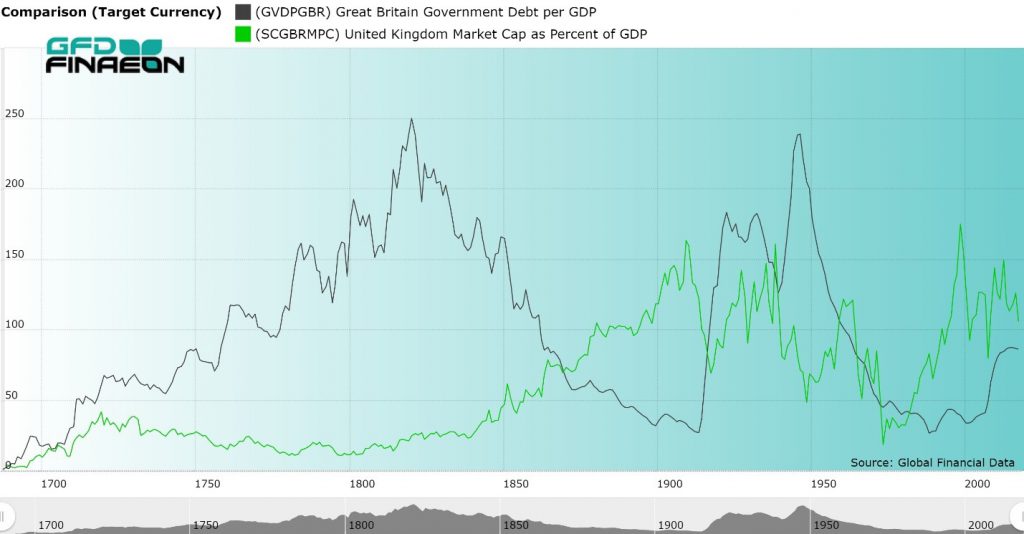
An even more fascinating picture is provided in Figure 2 which looks at the United Kingdom. There was clearly an inverse correlation between government debt and the stock market between 1688 and the 1980s. Both debt and stock market capitalization increased between 1688 and 1720 when the South Sea Bubble occurred. Between 1720 and 1820, central government debt rose while the stock market stagnated. Between 1820 and 1914, government debt plummeted while the stock market increased to over 150% of GDP. During the next 40 years, the stock market shrank in size while government debt grew between 1914 and 1945, then declined over the next 40 years. Since the 1980s, both government debt and stock market capitalization have increased in the United Kingdom as has occurred in the United States and other countries.

Figure 2. United Kingdom Government Debt and Stock Market Capitalization to GDP, 1688 to 2018
The addition of these series on government revenues, expenditures and debt will provide subscribers with a greater ability to understand the interaction between different financial markets. Using the graphs of the United States and United Kingdom, it appears that today money is flowing into both debt and the stock market simultaneously. Similar patterns exist in other countries. How long this will continue before this trend reverses remains to be seen.


