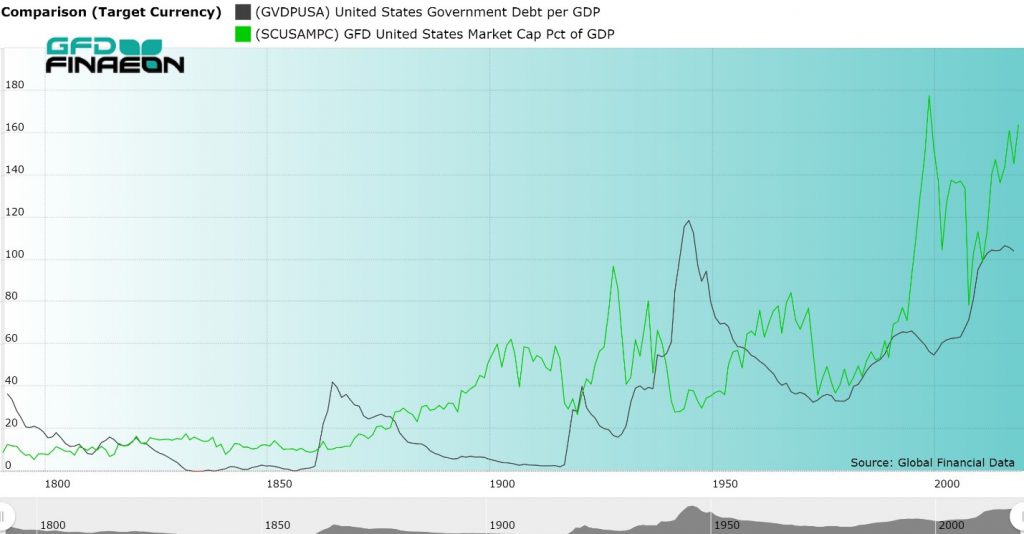
The United States stock market has broken to new highs in January 2020, continuing a bull market that began in March 2009. The S&P 500 has risen 382% since March 2009 and is approaching the record bull market of 1974-1987 in which the S&P 500 rose 442%. This would be only the fourth time that an American bull market rose by more than 400% if this bull market continues. As Figure 1 shows, US stock market Capitalization is close to the same levels as in 1999 when the Internet Bubble burst. By our estimate, when the S&P 500 hits 3650, the stock market’s capitalization will be twice GDP.
Global Financial Data tracks bull and bear markets in over 100 stock markets. We have calculated when bull and bear markets have begun and ended throughout the world beginning in 1602. We have over 100 years of data to analyze when bull and bear markets have begun and the number of market tops and bottoms that have occurred each year. GFD defines a bear market as a 20% decline in the primary market index for each country and a bull market as a 50% increase in the primary market index. A market top occurs when the index declines by 20% or more after a 50% increase, and a market bottom occurs when the market rises by 50% after a 20% decline.
Co-Authored by Michelle Kangas & Dr. Bryan Taylor
Warrant Buffett once said that the stock market capitalization to GDP Ratio (MC/GDP) is “probably the best measure of where valuations stand at any given moment.” Global Financial Data has decided to follow in Warren Buffett’s footsteps and has added data on the ratio of stock market capitalization to GDP for all the stock markets in the world. GFD has the most extensive historical data on stock market capitalization and GDP available anywhere. This enables us to provide data on Buffett’s favorite indicator going back centuries, not decades. MC/GDP data for the United States begins in 1792 and data for the United Kingdom begins in 1688.
There are several factors which influence the ratio of stock market capitalization to GDP. First, countries with more multinational companies have a higher ratio than countries without. The MC/GDP ratio is particularly high for Switzerland and Hong Kong because those countries have numerous multinationals listed on their exchanges. Switzerland’s MC/GDP ratio is over 200% and Hong Kong’s ratio is over 1000%. Second, interest rates influence the ratio. Bond yields provide an opportunity cost for investing in the stock market. The higher bond yields are, the lower will be the MC/GDP ratio. The lower bond yields are, the higher will be the ratio. Third, government ownership of major industries, banks and utilities reduces the MC/GDP ratio because these industries are publicly owned rather than privately owned. Fourth, industrialization of the economy increases the MC/GDP ratio and has generally increased over time. Fifth, whether a country relies more on markets or banks to direct capital to industry affects this ratio. Anglo-Saxon countries generally rely more on stock markets than continental European countries and tend to have a higher MC/GDP ratio. Sixth, wars tend to redirect capital to funding government bonds and increases regulation of industry. This tends to reduce the MC/GDP ratio. All of these factors should be taken into consideration when trying to analyze whether the MC/GDP ratio indicates that the stock market is overvalued or undervalued for any country.
GFD has created a simple mnemonic that enables subscribers to quickly find data for the country they are interest in. The ticker begins with “SC”, then adds the ISO code, then adds “MPC” at the end, so the symbol for the market cap of the United States as a share of GDP is SCUSAMPC and for Canada it is SCCANMPC.
There are many things that subscribers can do with this information. Figure 1 compares the stock market capitalization of the United States with the outstanding government debt as a share of GDP. Several of the factors mentioned above are clearly visible. The inverse correlation between war, stock market capitalization and debt is visible during World War I and World War II. The impact of rising interest rates in the 1970s and falling interest rates since 1981 have clearly impacted the MC/GDP ratio. Since 1980, both the debt/GDP and the MC/GDP ratios have risen. Over the past 50 years, the United States has deregulated many markets which has contributed to the increase in the MC/GDP ratio.

Figure 1. United States Government Debt and Stock Market Capitalization to GDP, 1792 to 2018
Global Financial Data provides data on the MC/GDP ratio for every major stock market in the world. GFD provides more history for this ratio than any other data vendor. The MC/GDP ratio in the United States is around 164% today. This is one of the highest ratios in history; however, bond yields are also at their lowest levels in history. Could the MC/GDP ratio be headed to 200% as in Switzerland, or does the high ratio portend a crash as occurred at previous peaks in 1999 and 2007? Time will tell.


