
On December 9, Paul Volcker, who served as Chairman of the Federal Reserve Bank from 1979 to 1987, died at the age of 92. Paul Volcker changed the shape of the economy and of financial markets.
The Rise and Fall of Interest Rates
Paul Volcker is known for two things. He instituted the Volcker Rule as part of the Dodd-Frank Wall Street Reform and Consumer Protection Act. This prohibited banks from conducting some investment activities with their own accounts and limited their dealings with hedge funds and private equity funds.
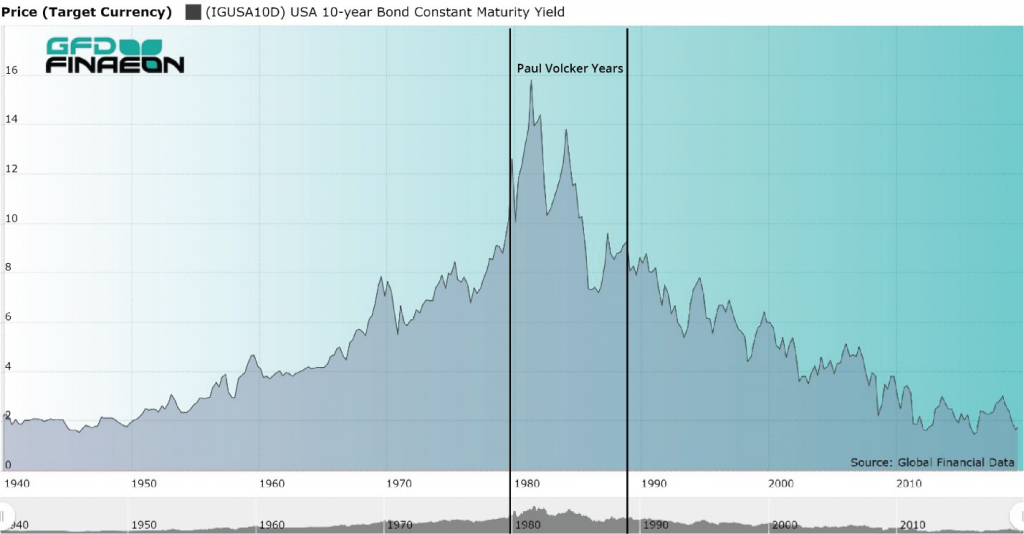
Figure 1. USA 10-year Government Bond Yield, 1940 to 2019
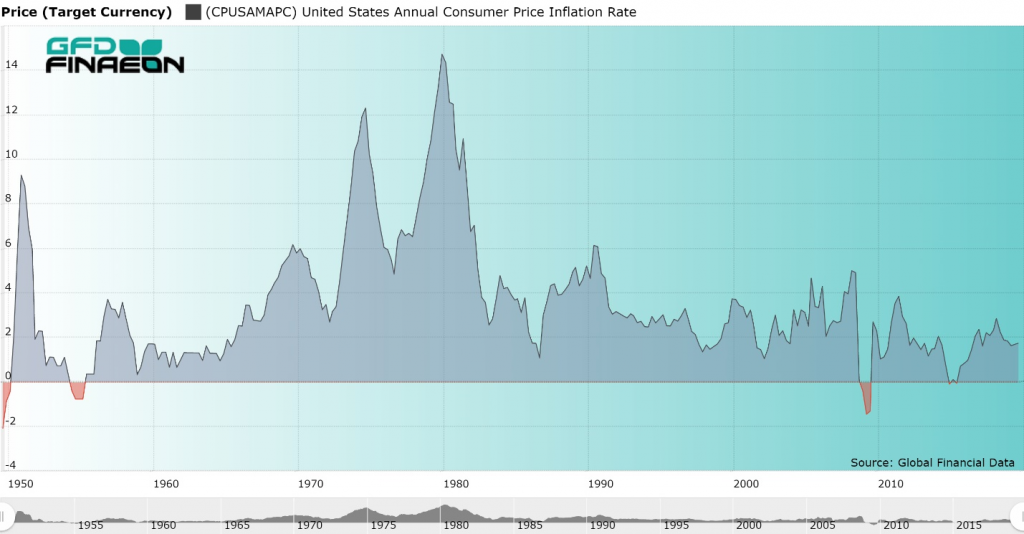
Figure 2. United States Inflation Rate, 1950 to 2019
Second, Paul Volcker defeated the rising inflation and interest rates of the 1970s. In 1981, the yield on the 10-year bond peaked at 15.84% as can be seen in Figure 1. Today, the bond yield and inflation are both below 2% as depicted in Figures 1 and 2. Government bond yields in most of the Euro zone are negative in nominal terms and are negative in real terms in the United States. There is no sign that bond yields, interest rates or inflation will reverse and begin rising in the near future. If anything, bond yields are likely to continue to decline in the United States.
Paul Volcker Reverses 40 Years of Rising Rates
Paul Volcker instituted major changes that impacted investors. Between 1792 and 1941, stocks provided a 6.80% return while bonds provided a 4.99% return. Then the great Keynesian inflation began. Between 1941 and 1981, US equities returned 11.38% while the 10-year bond returned only 2.75% as can be seen in Figure 3. Inflation averaged 4.60% during those 40 years meaning that after inflation bond investors actually lost money as is illustrated in Figure 4.
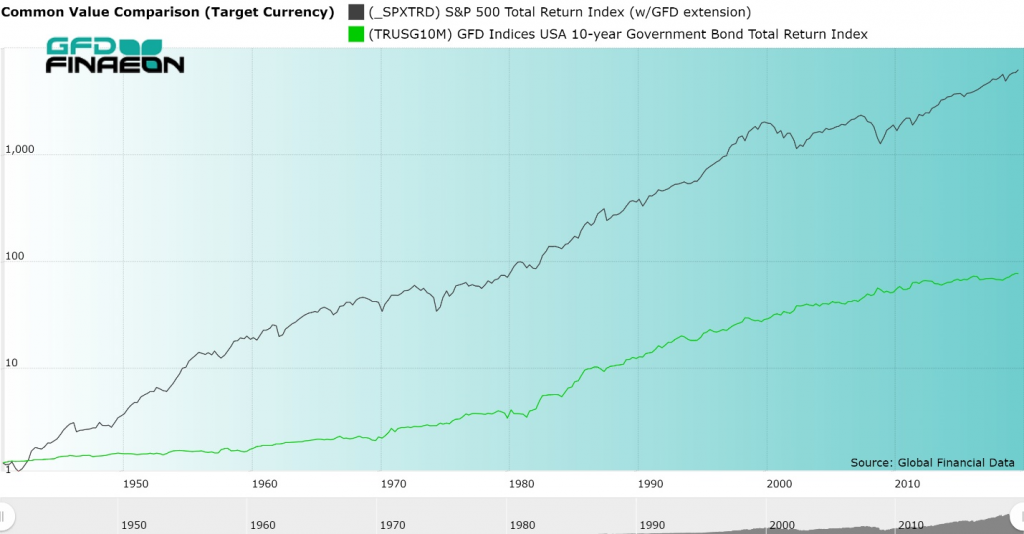
Figure 3. S&P 500 Composite Total Return and Government Bond Total Returns, 1940 to 2019
However, between 1981 and 2018, stocks returned 11.13% and bonds returned 8.04%. This is illustrated in Figure 4. Bonds made no progress from 1940 to 1981, then provided dramatic returns from 1981 to 2019. The cause of this change was Paul Volcker. Although there was little difference in the annual return to equities, the return to bonds rose significantly as the decline in bond yields produced capital gains rewarding bond investors.
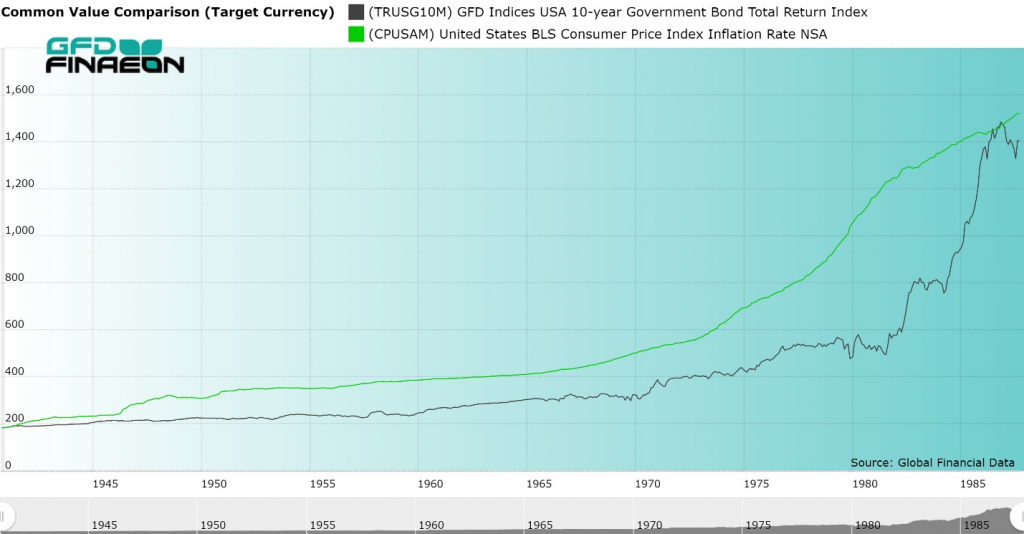
Figure 4. United States Government Bond Return Index and Consumer Prices, 1941 to 1987
The years between 1941 and 1981 were atypical of American financial history. The equity risk premium rose from 1.72% between 1792 to 1941 to 8.40% between 1941 and 1981. As equity markets recovered after World War II, bond investors were punished with rising bond yields, and many investors falsely interpreted the high returns as the standard for the equity risk premium.
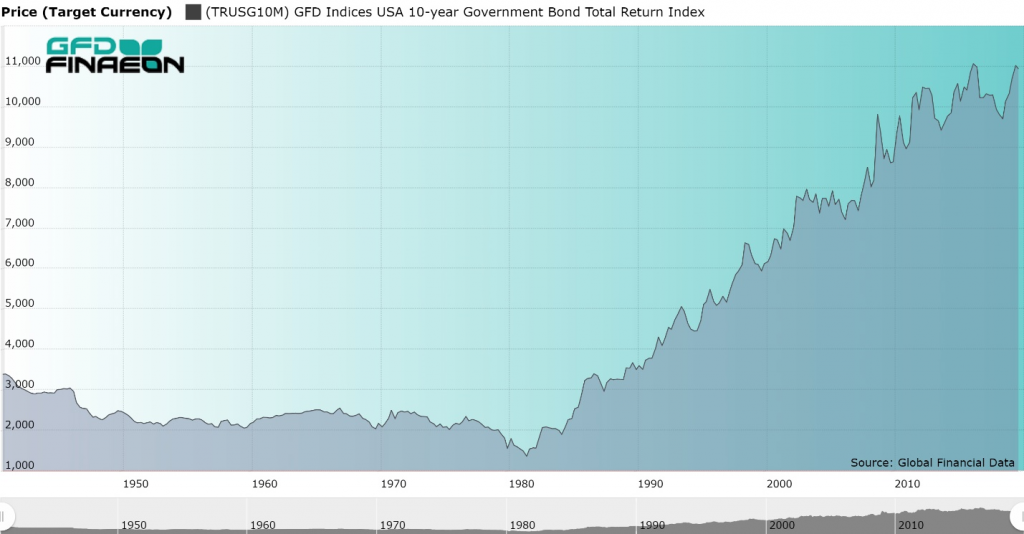
Figure 5. U.S. Government Bond Returns Adjusted for Inflation, 1940 to 2019
The Death of the Equity Risk Premium
Investors began to expect high returns on stocks; however, between 1981 and 2018, the equity risk premium fell back to 2.75%. This is illustrated in Figure 6. In some countries, such as Canada, government bonds have beaten the stock market since 1981. Most people believe that the equity risk premium is around 6% or even more when historically, except for the period between 1941 and 1981, the equity risk premium has been around 3%. Although bond yields may still decline in the next few years, the room for decline is minimal.

The 2020s have begun. During the 2010s, the fixed-income market has done things no one would have predicted when the 2010s began ten years ago. The most important feature of the past decade has been the steady decline in government bond yields, falling to negative nominal yields in most of Europe and negative real yields in the United States and Canada.
Government bond yields have been declining since 1981 throughout the world. In the United States, the 10-year bond yield was 3.85% at the end of 2009, but has declined to under 1.90% today. The yield on 10-year government bonds in Japan has declined from 1.30% in 2009 to -0.06% in 2019 while German bond yields have declined from 3.37% to -0.30%. Across the world, interest rates are negative in real terms. In Switzerland, even the 50-year bond has a negative return.
I believe that interest rates cannot continue to decline. Why accept a negative return when you can always hold cash with a zero return? There are transaction costs of buying and selling bonds. Although these costs can be easily factored into a long-term bond, this is more difficult with a short-term bond. Will the 38-year bull market in bonds driven by declining yields come to an end? Is a new multi-decade pattern of rising bond yields replacing the declining yields of the past few decades? There are over $10 trillion in outstanding government bonds with negative yields in the world. Many of these bonds are owned by governments so the yield is almost irrelevant. Will bond yields still be negative ten years from now? Will interest rates decline or rise during the decade to come?
The Interest Rate Pyramid
We are currently in a 75-year cycle of rising and falling interest rates. The government controlled interest rates during World War II to limit the government’s cost of funding the debt it issued to pay for the war. When the war was over, the government allowed the market to once again determine bond yields, and the government’s policies fed inflation driving prices and bond yields up between 1945 and 1981. Paul Volker decided to fight inflation at any cost and reversed the pattern of rising inflation and interest rates. Inflation and bond yields have declined since 1981 falling from 15.81% in 1981 to under 2% today.
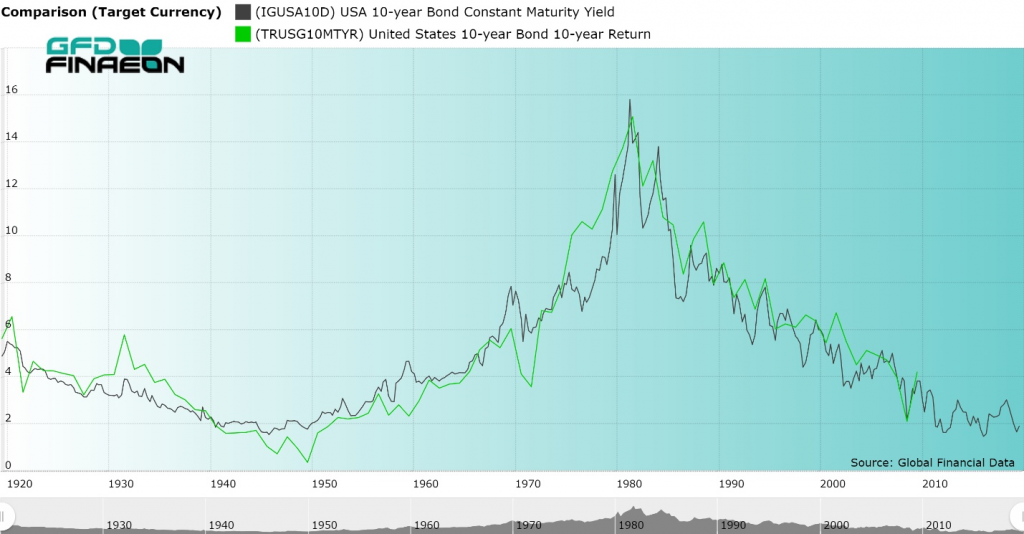
Figure 1. United States 10-year Government Bond Yield and Return, 1919 to 2019
Fixed-income investors are concerned about two factors, the capital gain or loss they receive when there is a change in the bond yield and the interest payments they receive each six months from the government. GFD’s 10-year Total Return Government Bond index takes both of these factors into consideration in calculating the total return to holders of government bonds. During the period of rising interest rates between 1945 and 1981, bondholders received higher interest payments over time, but lost money as higher interest rates drove the price of bonds down. The opposite effect has occurred since 1981.
What is interesting is that the capital gain/loss that occurs because of rising or falling bond yields offsets the interest bondholders receive to even out the return to investors. The assumption is that as the bondholder receives interest payments over time, this money is reinvested in government bonds at the current yield in the market. In theory, the bondholder could completely reinvest his principal and interest in a new bond each year. Bondholders can also invest in mutual funds that effectively do this for them. The interesting thing is that over the past 75 years, the capital gain/loss that has been generated by the rising and falling bond yields has offset the rising and falling coupons that have occurred over time.
Figure 1 compares the yield on the US 10-year bond in black with the total return to an index of bonds invested in 10-year government bonds in green. The return index compares the return to government bond holders between 2008 and 2018 with the yield to government bonds in 2008. Of course, you would have needed to wait until 2018 to find out what the return was to investors in government bonds in 2008, but as Figure 1 shows, the correlation between the yield on government bonds at any point in time and the actual return investors receive over the next ten years is uncanny. The fact that this pattern has persisted for the past 100 years is amazing.
Examining other countries, you get similar results. Figure 2 shows the relationship between bond yields and returns for Japan and Figure 3 shows the relationship for France. The relationship between bond yields and returns is not always as strong as it is in the United States, but the general relationship still exists.
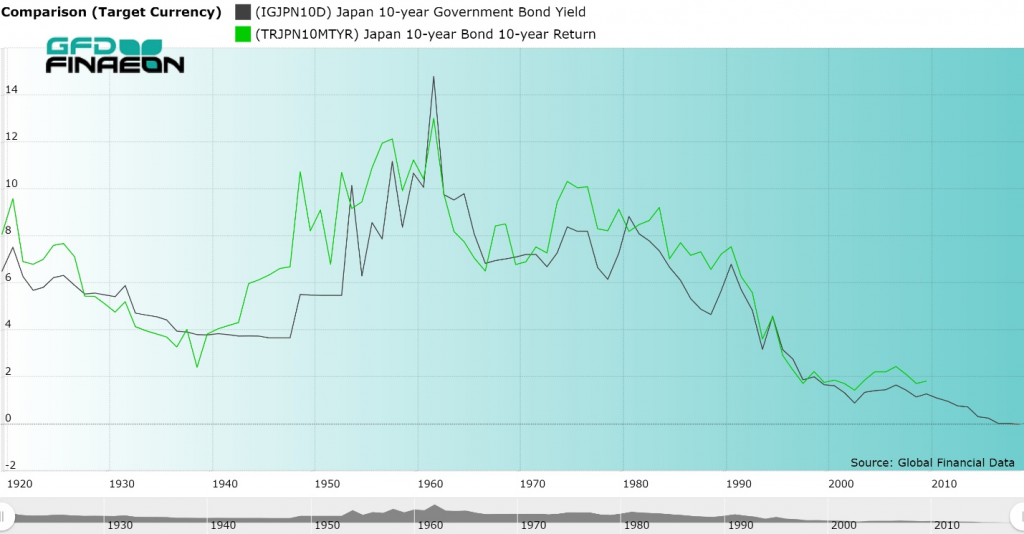
Figure 2. Japan 10-year Government Bond Yield and Return, 1919 to 2019
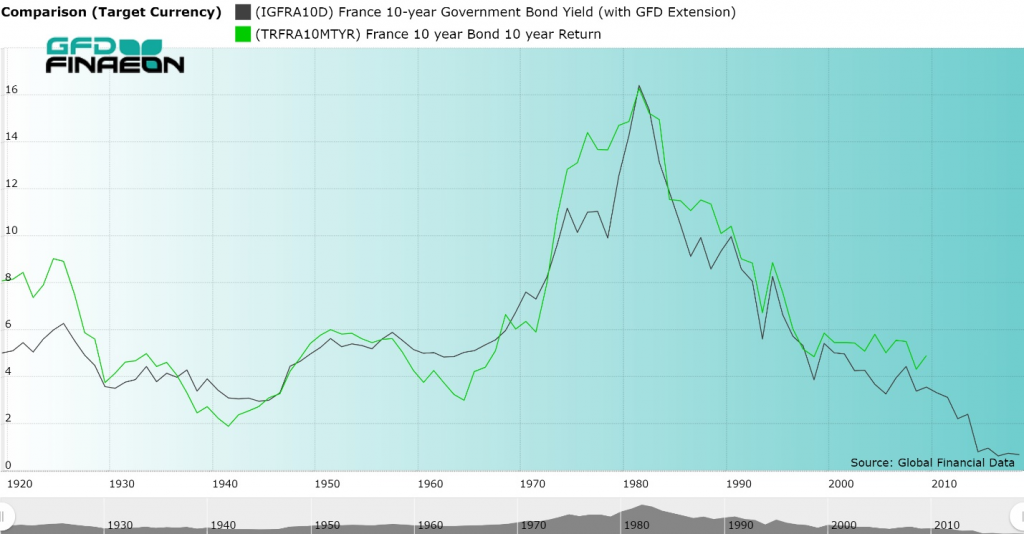
Figure 3. France 10-year Government Bond Yield and Return, 1919 to 2019
The Decade to Come
Examination of global bond yields in Figure 4 compares bond yields over the past 20 years in the United States, Germany, the United Kingdom, Japan, Canada, Australia and Switzerland. Interest rates in Germany, Japan and Switzerland have turned negative, and after adjusting for inflation, you would find that real yields in the remaining countries are negative.
If you look at the yield and return graphs for the United States, Japan and France in Figures 1, 2 and 3, you will see that the returns are not provided after 2009 because we don’t know what the behavior of bonds in the 2020s will be and thus cannot calculate the total return to bondholders between 2012 and 2022, for example, because this number will not be known until 2022.
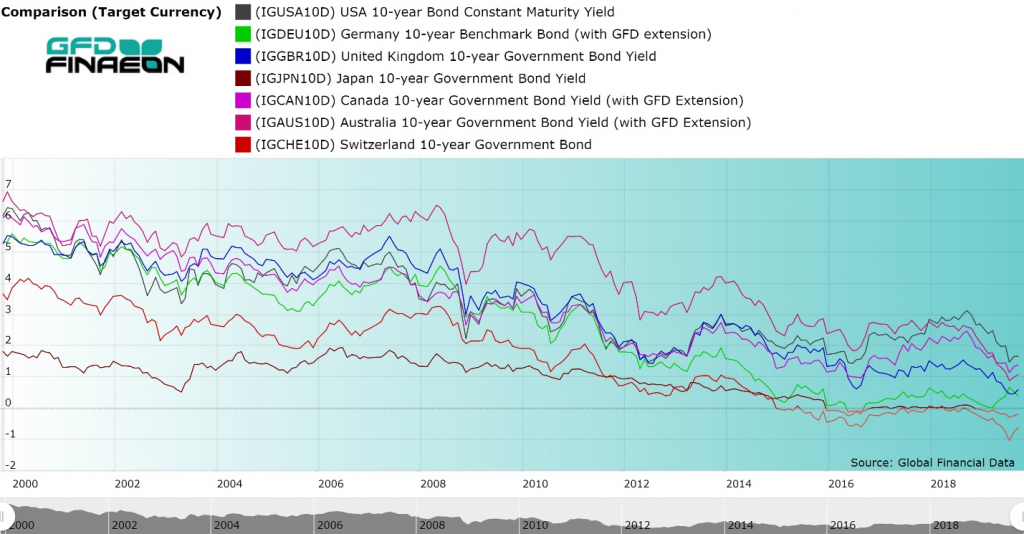
Figure 4. 10-Year Government Bond Yields for Seven Countries, 2000 to 2019
The inevitable logic that would come from this analysis so far is that if the yield on government bonds declined in the 2010s as they did in the 1980s, 1990s and 2000s, then a continued decline in government bond yields during the next decade is the most logical outcome. If bond yields were to rise, this would impose capital losses on bondholders, driving the total return to negative levels even below the yields that persisted in the 2010s.
To illustrate this fact, I have calculated what the total return to US government bondholders would be if bond yields rose by 0.125% in each of the next ten years and if they fell by 0.125% annually starting at a yield of 2% at the end of 2019. With these assumptions, I can calculate both the return from interest payments and the impact on the price of government bonds as the money was reinvested. I provide the results in Figure 5. In reality, bond yields will not rise or fall each year at a constant rate, but will fluctuate. The overall results will be the same regardless.
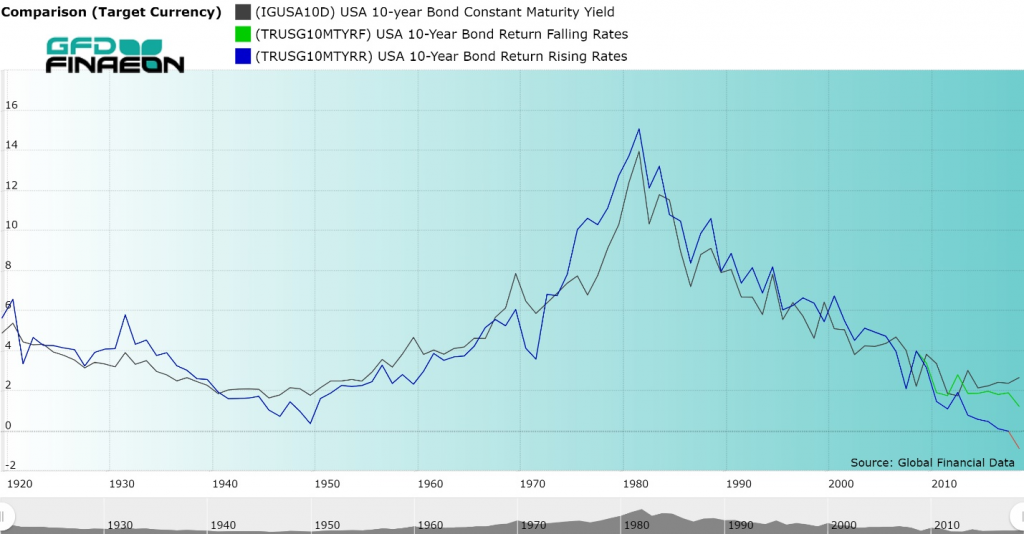
Figure 5. United States 10-year Government Bond Rising and Falling Yields and Returns
The black line in Figure 5 shows the path of government bond yields through 2019. The green line shows the returns that would occur if interest rates fell by 0.125% each year for the next 10 years, and the blue line shows what would happen if interest rates rose by 0.125% each year for the next 10 years. The cumulative effect of rising interest rates would be to generate negative returns to bondholders from 2019 by 2029. On the other hand, if government bond yields continue to fall, the decline in the total return is reduced by the capital gain shareholders would receive allowing returns to follow more closely to the bond yields that existed in the 2010s. Since the green line of falling interest rates adheres more closely to the actual behavior of interest rates between 2009 and 2019, it would seem more logical to predict falling interest rates over the course of the 2020s than rising interest rates.
Trouble in Bond Paradise
Whether you expect bond yields to rise or fall over the next 10 years, the conclusions reached in this paper should raise concerns for any fixed-income investor. If government bond yields rise over the next 10 years, by the end of the decade, if not earlier, fixed-income investors will receive a negative return on their investment. On the other hand, the only way for fixed-income investors to avoid negative returns is to hope for falling bond yields. Rising bond prices will offset the decline in yields, but at the same time may only delay the inevitable losses that fixed-income investors will eventually have to incur when interest rates rise at some point in the future.
What is true of the United States is true of the rest of the world. As Figure 4 indicates, 10-year government bond yields are lower than they are in the United States in virtually every developed country in the world. There is currently over $10 trillion in notes and bonds with a negative yield. If bond yields don’t rise, investors will receive a negative return because of rising bond prices. If bond yields do rise, investors will receive a negative return because of rising bond prices.
Some would say that a return to rising bond yields is inevitable, but this isn’t necessarily true. Bond yields fell throughout the 1800s. Yields fell from 5.345% in 1803 to 2.43% in 1897. There is no reason why bond yields might not fall for decades if the Federal Reserve can keep inflation under control. Population growth and economic growth may remain stagnant and constrain any increase in inflation or interest rates in the future. Data on these indicators are available through the GFDatabase and GFD Indices. All of the 10-year bond yields extend further back than is displayed in Figure 4. Fixed-income investors may be condemned to lose money during the next decade. The only question is how much?

Global Financial Data has added over 600 files to its database that provide data on government revenues, government expenditures, the primary balance, interest paid on public debt and the amount of outstanding government debt as a share of GDP. The data cover 56 countries on government revenues, expenditures and interest expense and 200 countries on outstanding government debt.
GFD has combined its extensive database of historical data on government revenues, expenditures and debt with the recent work of Ayhan, Kurlat, Ohnsorge and Sugawara in their paper, “A Cross-Country Database of Fiscal Space” and of Mauro, Romeu, Binder and Zaman in their paper, “A Modern History of Fiscal Prudence and Profligacy” to produce an extensive database that enables users to measure government revenues, expenditures, debt and interest expense relative to GDP beginning in 1688 in the United Kingdom, 1792 in the United States and the 1800s in other major countries. This data has been updated through 2018 where possible.
Ayhan, Kurlat, Ohnsorge and Sugawara have produced a database that measures the Government Debt/GDP Ratio for 200 countries from 1990 until 2018. We have combined their research with GFD’s data on over 30 countries to provide long-term data series that provide insights into how the Government Revenues and Expenditures/GDP and Debt/GDP ratios have changed over time.
In addition to government debt, GFD has added data from the OECD on private debt that begins in 1995 and GFD has summed the private and public debt to provide total debt data for 31 countries that are members of the OECD that provide this data. This data is also expressed as a percentage of GDP.
GFD has created simple mnemonics that enable users to look up data on the different countries that include this data in the GFDatabase. How the codes were created for each of the six variables is provided in Table 1. For example, to obtain the code for Government Revenues as a share of GDP for the United States, simply add GVRP to the ISO Code for the United States, which is USA, to get GVRPUSA. For the Government Gross Debt as a Percentage of GDP for Japan, add GVDP to JPN and get GVDPJPN.
Government Revenues as % of GDP GVRP + ISO GVRPUSA
Government Expenditures as % of GDP GVXP + ISO GVRXUSA
Government Primary Expenditures as % of GDP GVPXP + ISO GVPXPUSA
Interest Paid on Public Debt as % of GDP GVIP + ISO GVIPUSA
Government Primary Balance as % of GDP GVBP + ISO GVBPISO
Government Gross Public Debt as % of GDP GVDP + ISO GVDPUSA
Private Outstanding Debt as a % of GDP PRVD + ISO PRVDUSA
Private and Public Debt as a % of GDP PPUD + ISO PPUDUSA
Table 1. Mnemonics for Government Revenues, Expenditures and Debt in the GFDatabase
Subscribers can do a thorough analysis of government revenues, expenditures and debt using these data series. By calculating each of these variables as a percentage of GDP, the series automatically adjust for inflation and growth in the economy to see how each has changed over time. Not surprisingly, all have grown steadily since the 1800s.
It is important to analyze the Debt/GDP ratio for two reasons. First, excessive debt can constrain growth in the economy. Reinhart and Rogoff have alleged that when the government debt/GDP ratio exceeds 90% that countries will suffer from lower growth than would otherwise have occurred. Second, if you combine high interest rates with a high government debt load, this reduces the level of services which the government is able to provide because government spending is absorbed by interest costs. Interest Paid on Public Debt as a Percentage of GDP enables you to see when this ratio got too high and forced governments to reorganize their finances.
However, it is important to recognize the relationship between capital available for debt and capital available for the stock market. These two factors often display an inverse relationship as is illustrated in Figure 1. When the government is fighting a war, the government directs capital toward the bonds that are issued to pay for the war and away from the stock market. Once the war is over, capital is freed up and can be redirected to new industries and help the stock market to grow. Stock markets have seen some of their most rapid growth and largest bubbles during periods after wars when capital is released from government debt and the capital flows into the stock market.
Figure 1 provides a fascinating chart that compares the ratios of Federal Government Debt to GDP with Capitalization of the US Stock Market relative to GDP. The increases in government debt that occurred during the Civil War, World War I and World War II are clearly visible, as is the increase in debt that has occurred since 1980. You can contrast the changes in government debt with changes in the capitalization of the US stock market. During the 1900s, there was often an inverse correlation between government debt and stock market capitalization with debt increasing at the expense of the stock market during World War I and World War II. As government debt declined after World Wars I and II, stock market capitalization rose. Since 1980, however, both government debt and stock market capitalization have increased their share of GDP.
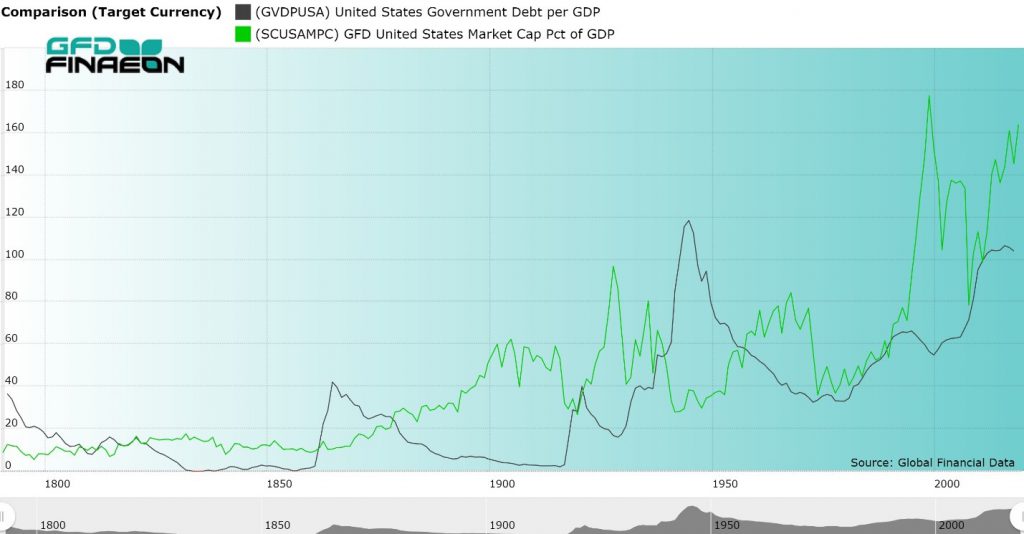
Figure 1. USA Federal Government Debt and Stock Market Capitalization to GDP, 1792 to 2018
An even more fascinating picture is provided in Figure 2 which looks at the United Kingdom. There was clearly an inverse correlation between government debt and the stock market between 1688 and the 1980s. Both debt and stock market capitalization increased between 1688 and 1720 when the South Sea Bubble occurred. Between 1720 and 1820, central government debt rose while the stock market stagnated. Between 1820 and 1914, government debt plummeted while the stock market increased to over 150% of GDP. During the next 40 years, the stock market shrank in size while government debt grew between 1914 and 1945, then declined over the next 40 years. Since the 1980s, both government debt and stock market capitalization have increased in the United Kingdom as has occurred in the United States and other countries.
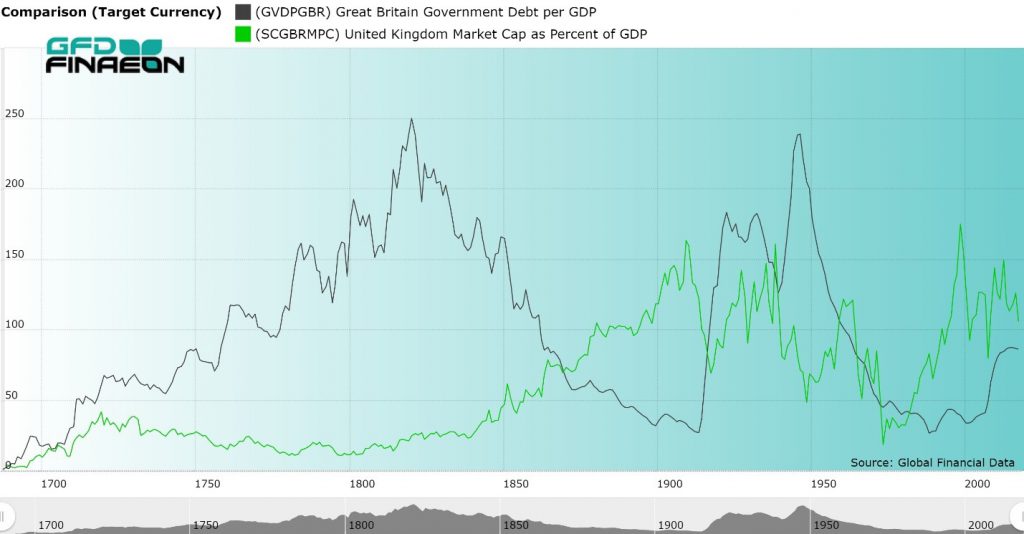
Figure 2. United Kingdom Government Debt and Stock Market Capitalization to GDP, 1688 to 2018
The addition of these series on government revenues, expenditures and debt will provide subscribers with a greater ability to understand the interaction between different financial markets. Using the graphs of the United States and United Kingdom, it appears that today money is flowing into both debt and the stock market simultaneously. Similar patterns exist in other countries. How long this will continue before this trend reverses remains to be seen.

25 years ago: January 1995
S&P 500: 470.42 (vs. 3253.05 in 01/2020)
10-year U.S. Government Bond Yield: 7.60% (vs. 1.85% in 01/2020)
Gold: $374.90 (vs. $1571.95 in 01/2020)
Oil: $18.405 (vs. $59.65 in 01/2020)
GBP/USD: 1.5785 (vs. 1.3077 in 01/2020)
US GDP: $7,331 billion (vs. $21,542 billion in 09/2019)
US Population: 266 million (vs. 329 million in 2019)
01/02/1995: Mexico develops a rescue plan to deal with the crisis sparked by last month’s peso devaluation.
01/03/1995: The U.S. and China move close to a trade war as President Clinton threatens 100% tariffs if China refuses to halt software and media piracy.
01/06/1995: A chemical fire in an apartment complex in Manila, Philippines, leads to the discovery of plans for Project Bojinka, a mass-terrorist attack.
01/12/1995: Orange County sues Merrill for $3 billion, charging the firm wantonly and callously sold it high-risk securities.
01/14/1995: Mexico pledges profits from state-owned Pemex’s $7-billion-per-year oil revenues in an effort to secure U.S. congressional approval of $40-billion worth of loan guarantees. Subsequently, President Clinton approved a $20-billion U.S. aid package for Mexico. (DMN)
01/17/1995: The Great Hanshin earthquake: A magnitude 7.3 earthquake occurs near Kobe, Japan, causing extensive property damage and killing 6,434 people.
01/22/1995: Israeli-Palestinian conflict: Beit Lid massacre In central Israel, near Netanya, two suicide bombers from the Gaza Strip blow themselves up at a military transit point killing 19 Israelis.
01/23/1995: Glaxo offers $14.15 billion for Wellcome PLC to become largest prescription drug company in the world.
01/31/1995: President Bill Clinton authorizes a $20 billion loan to Mexico to stabilize its economy.
50 years ago: January 1970
S&P 500: 85.02 (vs. 3253.05 in 01/2020)
10-year U.S. Government Bond Yield: 7.75% (vs. 1.85% in 01/2020)
Gold: $34.99 (vs. $1571.95 in 01/2020)
Oil: $3.21 (vs. $59.65 in 01/2020)
GBP/USD: 2.4015 (vs. 1.3077 in 01/2020)
US GDP: $1,030 billion (vs. $21,542 billion in 09/2019)
US Population: 209 million (vs. 329 million in 2019)
01/02/1970: DJ Rail Average became Transportation Average. Some rails were deleted; certain airline, freight carrier issues added. Pacific Intermountain Express Co., Transway International Corp., Trans World Airlines, Eastern Airlines, Northwest Airlines Inc. Pan American Corp. United Airlines, American Airlines and CNF Transportation Inc. added to the Dow Jones Transportation Average.
01/04/1970: A magnitude 7.7 earthquake strikes Tonghai County, China, killing at least 15,000 people.
01/12/1970: Biafra capitulates, ending the Nigerian Civil War.
01/22/1970: The Boeing 747, the world’s first “jumbo jet”, enters commercial service for launch customer Pan American Airways with its maiden voyage from John F. Kennedy International Airport to London Heathrow Airport.
100 years ago: January 1920
S&P 500: 8.7647 (vs. 3253.05 in 01/2020)
10-year U.S. Government Bond Yield: 4.93% (vs. 1.85% in 01/2020)
Gold: $20.67 (vs. $1571.95 in 01/2020)
Oil: $5.063 (vs. $59.65 in 01/2020)
GBP/USD: 3.4975 (vs. 1.3077 in 01/2020)
US GDP: $84 billion (vs. $21,542 billion in 09/2019)
US Population: 106.46 million (vs. 329 million in 2019)
01/02/1920: The second Palmer Raid takes place with another 6,000 suspected communists and anarchists arrested and held without trial. These raids take place in several U.S. cities.
01/07/1920: Federal Reserve banks start to raise rates. The New York State Assembly refuses to seat five duly elected Socialist assemblymen.
01/08/1920: AFL Iron and Steel Organizing Committee concluded an unsuccessful 3 1/2 month strike in steel industry.
01/10/1920: League of Nations organized. The Treaty of Versailles takes effect, officially ending World War I. The Memel Mark and the Danzig Mark replaced the German Mark at par.
01/15/1920: Francisco Jose Fernandes Costa (Republican Liberal) became Prime Minister of Portugal
01/16/1920: XVII Amendment (Prohibition) effective (repealed Dec. 1933).
01/19/1920: The United States Senate votes against joining the League of Nations.
01/20/1920: The American Civil Liberties Union is founded.
01/23/1920: The Netherlands refuses to surrender the exiled Kaiser Wilhelm II of Germany to the Allies.
01/26/1920: Former Ford Motor Company executive Henry Leland launches the Lincoln Motor Company which he later sold to his former employer.
200 years ago: January 1820
S&P 500/GFD US-100: 1.576 (vs. 3253.05 in 01/2020)
10-year U.S. Government Bond Yield: 4.348% (vs. 1.85% in 01/2020)
Gold: $19.39 (vs. $1461.70 in 01/2020)
GBP/USD: 4.44 (vs. 1.3115 in 01/2020)
US GDP: $727 million (vs. $21,542 billion in 09/2019)
US Population: 9.6 million (vs. 329 million in 2019)
01/28/1820: A Russian expedition led by Fabian Gottlieb von Bellingshausen and Mikhail Petrovich Lazarev discovers the Antarctic continent, approaching the Antarctic coast.
01/29/1820: Death of George III of Great Britain.
01/30/1820: Edward Bransfield sights the Trinity Peninsula and claims the discovery of Antarctica.
© 2020 Global Financial Data. Please feel free to redistribute this Events-in-Time Chronology and credit Global Financial Data as the source.
