
The Great Bull Market of 2009 to 2019 continues to push the stock market to new highs. The capitalization of the New York Stock Exchange and NASDAQ is now about $37.5 trillion which is equal to 174% of America’s Gross Domestic Product. If the market continues to rise, the American stock market will soon have its largest Market Capitalization/GDP Ratio (MCap/GDP) in history.
The American stock market first exceeded 100% of GDP in September 1929 before it crashed to its 1932 lows at less than 25% of GDP. The stock market’s capitalization didn’t exceed GDP again until 1996. The Dot.com Bubble of the late 1990s pushed the Stock Market Capitalization/GDP Ratio up to 177%, its highest in history. During the financial crisis of 2008, the MCap/GDP ratio fell below 70%, but has bounced back since then. The United States stock market is close to reaching that peak again and the only question is not whether the stock market will exceed the record MCap/GDP ratio of 1999, but when and by how much before the next bear market pummels investors?
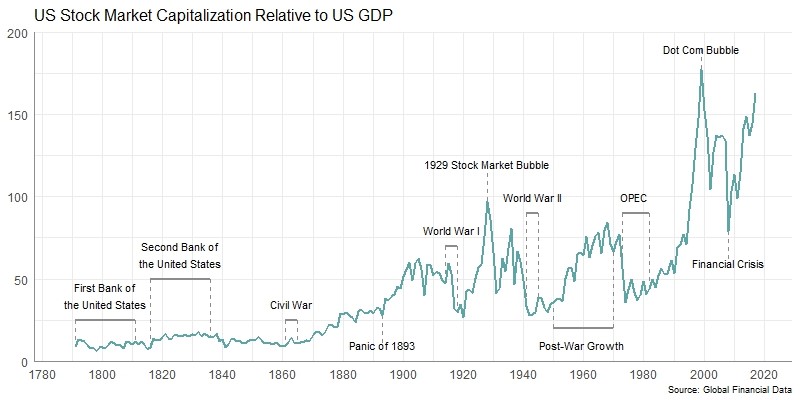
In order for the MCap/GDP ratio to be at 200%, the stock market would have to increase to $43.1 trillion, about 15% over the current levels in the stock market. This would mean that the S&P 500 would have to rise to about 3650 for the stock market’s capitalization to be double GDP. Although a market cap that is double GDP may seem excessive, it is not impossible. Switzerland’s MCap/GDP Ratio is currently over 200% and Hong Kong’s MCap/GDP ratio is currently over 1000%, primarily because of Chinese companies that list in Hong Kong.
The stock market has risen 35% from its December 2018 lows and many analysts predict that the stock market will rise to new highs in 2020. If the S&P 500 were to increase to 3675, the stock market’s capitalization will be double GDP. Mark 3650 on your S&P 500 charts and if we achieve that level in the stock market next year, you will know that the stock market will have achieved something it has never done before in American history, reaching a capitalization twice GDP. The Bubble of the 2020s could be here soon.

25 years ago: December 1994
S&P 500: 459.27 (vs. 3132.52 in 12/2019)
10-year U.S. Government Bond Yield: 7.84% (vs. 1.85% in 12/2019)
Gold: $383.25 (vs. $1461.70 in 12/2019)
Oil: $17.765 (vs. $58.99 in 12/2019)
GBP/USD: 1.566 (vs. 1.3115 in 12/2019)
US GDP: $7,331 billion (vs. $21,542 billion in 09/2019)
US Population: 260 million (vs. 329 million in 2019)
12/01/1994: Orange County, Calif., says the value of its investment fund has dropped by an estimated $1.5 billion, as rising interest rates hurt derivatives in its highly leveraged portfolio.
12/05/1994: Fidelity says its flagship Magellan fund isn’t likely to make a year-end distribution as expected, citing a miscalculation.
12/06/1994: Clinton picks Robert Rubin to succeed Lloyd Bentsen as Treasury chief. California’s Orange County files for bankruptcy protection, the largest such municipal filing ever.
12/07/1994: Federal Reserve Chairman Alan Greenspan says there is little evidence of an economic slowdown, an indication that the Fed may not be finished raising short-term interest rates.
12/11/1994: Russian President Boris Yeltsin orders Russian troops into Chechnya.
12/14/1994: Construction begins on the Three Gorges Damon the Yangtze River.
12/15/1994: Clinton proposes tax cuts that he calls a Middle Class Bill of Rights, saying he favors a leaner, not a meaner government.
12/20/1994: Intel offers to replace all of its flawed Pentium chips, bowing to mounting pressure from customers. The Mexican peso begins its collapse by plunging 12.7%. The Mexican government would later abandon all efforts to support its currency. The Mexican devaluation led to a run on banks, which resulted in an 18% decline in deposits between December and March. Eight banks suspended and three banks collapsed. Through end of 1997, 63 of 205 banking institutions were closed or merged.
12/24/1994: Air France Flight 8969 is hijacked on the ground at Houari Boumedienne Airport, Algiers, Algeria. Over the course of 3 days 3 passengers are killed, as are all 4 terrorists.
50 years ago: December 1969
S&P 500: 92.06 (vs. 3132.52 in 12/2019)
10-year U.S. Government Bond Yield: 7.88% (vs. 1.85% in 12/2019)
Gold: $35.20 (vs. $1461.70 in 12/2019)
Oil: $3.21 (vs. $58.99 in 12/2019)
GBP/USD: 2.399 (vs. 1.3115 in 12/2019)
US GDP: $1,030 billion (vs. $21,542 billion in 09/2019)
US Population: 205 million (vs. 329 million in 2019)
12/01/1969: The first draft lottery in the United States is held since World War II.
12/04/1969: Black Panther Party members Fred Hampton and Mark Clark are shot and killed in their sleep during a raid by 14 Chicago police officers.
12/05/1969: Volume discounts initiated, giving large investors a commission price break on most trades exceeding 1,000 shares.
12/08/1969: An Olympic Airways Douglas DC-6 strikes a mountain outside of Keratea, Greece, killing 90 the worst crash of a DC-6.
12/09/1969: U.S. Secretary of State William P. Rogers proposes his plan for a ceasefire in the War of Attrition; Egypt and Jordan accept it over the objections of the PLO, which leads to civil war in Jordan in September 1970.
12/12/1969: Far-right terrorists bomb the Banca Nazionale dell’Agricoltura in Milan (Piazza Fontana bombing), killing 17 people and wounding 88. Four more bombs detonate without victims. Investigations are blurred, and no responsible party has been held accountable.
12/24/1969: Charles Manson is allowed to defend himself at the Tate-LaBianca murder trial.
100 years ago: December 1919
S&P 500: 9.0235 (vs. 3132.52 in 12/2019)
10-year U.S. Government Bond Yield: 4.90% (vs. 1.85% in 12/2019)
Gold: $20.67 (vs. $1461.70 in 12/2019)
Oil: $5.00 (vs. $58.99 in 12/2019)
GBP/USD: 3.75 (vs. 1.3115 in 12/2019)
US GDP: $84 billion (vs. $21,542 billion in 09/2019)
US Population: 104 million (vs. 329 million in 2019)
12/01/1919: Lady Astor becomes the first female Member of Parliament to take her seat in the House of Commons of the United Kingdom. (She had been elected to that position on November 28.)
12/03/1919: After nearly 20 years of planning and construction, including two collapses causing 89 deaths, the Quebec Bridge opens to traffic.
12/12/1919: Manuel Allende Salazar (Conservative) became Prime Minister of Spain
12/13/1919: Australian federal election, 1919: Billy Hughes reelected as Prime Minister.
12/21/1919: American anarchist Emma Goldman is deported to Russia.
12/24/1919: Rockefeller gives $100 million for education and well-being of mankind.
12/26/1919: Babe Ruth of the Boston Red Sox is sold to the New York Yankees by owner Harry Frazee.
12/30/1919: Lincoln’s Inn in London, England, UK admits its first female bar student.
200 years ago: December 1819
S&P 500/GFD US-100: 1.6735 (vs. 3132.52 in 11/2019)
10-year U.S. Government Bond Yield: 4.15% (vs. 1.85% in 11/2019)
Gold: $19.39 (vs. $1461.70 in 11/2019)
GBP/USD: 4.529 (vs. 1.3115 in 11/2019)
US GDP: $727 million (vs. $21,542 billion in 06/2019)
US Population: 9.379 million (vs. 329 million in 2019)
12/01/1819: Bank of Amsterdam closed by government decree; liquidation began in January and lasted a long time.
12/14/1819: Alabama becomes the 22nd U.S. state.
12/17/1819: Simon Bolivar declares the independence of Gran Colombia in Angostura (now Ciudad Bolivar in Venezuela).
© 2019 Global Financial Data. Please feel free to redistribute this Events-in-Time Chronology and credit Global Financial Data as the source.
 The Global Financial Database has more equity history for India than for any other country. The British East India Co. was founded on December 31, 1600, preceding the founding of the Dutch East India Co. by one year. Originally, shares were issued for specific ventures to India, but in 1657, joint stock shares were issued and these shares continued to trade in London until the company was dissolved in 1874 and the British government took over ownership of the company. The East India Co. paid a consistent 10.5% dividend from 1793 until the company’s dissolution in 1874. From the late seventeenth century until the early eighteenth century, 95% of Asian imports into Britain come from Mughal India and consisted mainly of cottons and spices produced in India. The decline of Mughal India in the first half of the eighteenth century led to the rise of the British East India Co. which took over India from the Mughal Empire after its victory in the Battle of Plessey in 1757. During the 1800s, the manufacture of textiles moved from India to Britain as the Industrial Revolution enabled Britain to produce the textiles it had formerly imported from India.
During the 1850s, British investment in India boomed, establishing railroads, canals, shipping companies and utilities that were essential not only for the development of the Indian economy, but to enforce Britain’s control over the colony. Merchants in Manchester and London supported building railroads that linked India’s main ports to the interior to bring cotton and other goods to the rest of the world. However, these railroads did not prove profitable, and the British government had to guarantee the 5% dividends the India railroads paid.
In the 1860s, investment in India spread to other sectors. Banks, tea companies, telegraph companies and gold mines were the most popular investments in India. The civil war in the United States led to an increase in demand for cotton causing a bubble in equity markets which burst when the American civil war ended. Although cotton and clothing represented a large portion of India’s production, most of these companies used local capital rather than British funds.
Traders dealt in securities in Calcutta in 1830, trading shares of the East India Co. Twenty-Two stockbrokers met under banyan trees in front of Bombay’s Town Hall in 1855 to trade shares. Premchand Roychand was a native Indian who became a stock broker in 1849 and was a founding member of The Native Share and Stock Brokers Association which later became the Bombay Stock Exchange.
Roychand had earned his fortune when the American Civil War drove the price of cotton up. This led to a speculative bubble in 1864 in which Back Bay Reclamation stock rose from 5,000 rupees to 50,000 rupees. Money made from cotton was redirected into the stock market, and new companies were floated to unsuspecting speculators. The number of companies traded in Bombay grew from 10 in 1855 to 62 in 1862 and over 100 by 1864. The market crashed in May 1865 when the American Civil War ended and Back Bay Reclamation stock fell from 50,000 Rupees to 2,000. Bank of Bombay stock fell from 2,850 rupees to 87. Hundreds of time bargains matured on July 1, 1865 and many speculators were wiped out.
The stock brokers moved to Dalal (Brokers’) Street in 1874. The Bombay Stock Exchange was founded on July 9, 1875 as the Native Share and Stock Brokers Association and was the first stock exchange established in Asia. The Calcutta Stock Exchange incorporated in 1908. Stock exchanges opened up throughout India in the twentieth century. Nineteen former stock exchanges have closed in India since 2000. Today, most trading in Indian stocks takes place on either the Bombay Stock Exchange or the National Stock Exchange, founded in 1992. Both have a market cap of over $2 trillion.
GFD’s index for India uses data on the East India Co. exclusively from 1692 until 1845. A second East India Co. existed between 1698 and 1708, but it merged with the old East India Co. in 1708 because the competition between the two was eliminating their profitability. Data for the East India Railway begins in 1846 and the number of Indian companies that listed in London grew to 20 in the 1860s and peaked at around 50 in 1900. Data for India companies listed in London is used from 1690 to 1922. The number of companies remained around 50 until 1922 when a stock index based upon shares that traded in India was introduced. The domestic India index used data from 100 companies from the Calcutta, Bombay and Madras stock exchanges. By linking together data from The East India Co. from 1690 to 1845, the London Stock Exchange from 1846 to 1922 and from Indian stock exchanges from 1922 to the present, we have been able to provide over three centuries of data on stock companies that operated in India.
Railroads represented a majority of the capitalization in London during the 1800s. You can divide the role of railroads in India into four eras. Up until 1869, British companies constructed and managed the trunk lines that were built with the government providing guarantees on the shares. In the 1870s, the Government of India joined the private companies and began to construct and manage the railways. There were ten private companies incorporated in Britain, which built and managed the trunk lines through India. In the early 1880s, the Government of India began forming public-private partnerships with the Government of India becoming the majority owner of most of the railways in India. In addition to this, after the Afghan War of 1878, the government saw the benefit of building railroads for military use, not just for transporting freight and passengers. The government began to nationalize the railroads in 1924. In 1951, forty-two railways were consolidated into a single Indian Railway completing the nationalization of the nation’s railways.
The first railway was built in India in 1832 and the first passenger railroad opened in 1853 between Bombay and Thane. During the 1800s, about 90 percent of the shares were British-owned and almost all of the capital was raised through equity, not through bonds. The railroad network grew rapidly between 1880 and 1900 and by the early 1900s, India had the fourth largest rail network in the world. By 1900, India had 39, 834 kilometers of railways open, 10,000 more than was open in the United Kingdom, while China had only 1,000 kilometers of railways.
Most railroads received guarantees from the British government so that if their dividends fell below a certain level, usually 5%, the railroad could borrow money from the government to meet the guaranteed return. Because most railways were unable to achieve the 5% rate of return and had to borrow from the government year after year, the government had the right to acquire the railroad after 25 years of subsidies. The government acquired a share of ownership beginning in the 1880s and in the 1920s, most of the railroads were nationalized. The trade-off was that stock in the railways, which represented a majority of the capitalization of the stock market, traded like bonds. Shareholders received a guaranteed return, but railways lacked the incentive to maximize their profits, limiting increases in the price of railway stocks.
By the 1870s, the stock market capitalization of India exceeded its GDP, but as railroads were slowly nationalized, the market cap/GDP ratio continually shrank. The British government did not attempt to develop the Indian economy in the same way that development occurred in the United States, Canada and Australia. The British desire to control the Indian economy and focus on industries that could develop natural resources that could provide exports to Britain and the rest of the world hindered its economic growth. If anything, India deindustrialized in the 1800s as growth in the textile industry in England replaced the demand for textiles from India. Investment went into cotton, tea, and gold mining, all natural resources, but there was little attempt to develop industry in India. British control over the economy bred an anti-colonialism among Gandhi and other supporters of independence that led to socialist policies once India became an independent country after World War II. It wasn’t until the 1980s that India began to promote private business and the stock market began to rise again.
The Global Financial Database has more equity history for India than for any other country. The British East India Co. was founded on December 31, 1600, preceding the founding of the Dutch East India Co. by one year. Originally, shares were issued for specific ventures to India, but in 1657, joint stock shares were issued and these shares continued to trade in London until the company was dissolved in 1874 and the British government took over ownership of the company. The East India Co. paid a consistent 10.5% dividend from 1793 until the company’s dissolution in 1874. From the late seventeenth century until the early eighteenth century, 95% of Asian imports into Britain come from Mughal India and consisted mainly of cottons and spices produced in India. The decline of Mughal India in the first half of the eighteenth century led to the rise of the British East India Co. which took over India from the Mughal Empire after its victory in the Battle of Plessey in 1757. During the 1800s, the manufacture of textiles moved from India to Britain as the Industrial Revolution enabled Britain to produce the textiles it had formerly imported from India.
During the 1850s, British investment in India boomed, establishing railroads, canals, shipping companies and utilities that were essential not only for the development of the Indian economy, but to enforce Britain’s control over the colony. Merchants in Manchester and London supported building railroads that linked India’s main ports to the interior to bring cotton and other goods to the rest of the world. However, these railroads did not prove profitable, and the British government had to guarantee the 5% dividends the India railroads paid.
In the 1860s, investment in India spread to other sectors. Banks, tea companies, telegraph companies and gold mines were the most popular investments in India. The civil war in the United States led to an increase in demand for cotton causing a bubble in equity markets which burst when the American civil war ended. Although cotton and clothing represented a large portion of India’s production, most of these companies used local capital rather than British funds.
Traders dealt in securities in Calcutta in 1830, trading shares of the East India Co. Twenty-Two stockbrokers met under banyan trees in front of Bombay’s Town Hall in 1855 to trade shares. Premchand Roychand was a native Indian who became a stock broker in 1849 and was a founding member of The Native Share and Stock Brokers Association which later became the Bombay Stock Exchange.
Roychand had earned his fortune when the American Civil War drove the price of cotton up. This led to a speculative bubble in 1864 in which Back Bay Reclamation stock rose from 5,000 rupees to 50,000 rupees. Money made from cotton was redirected into the stock market, and new companies were floated to unsuspecting speculators. The number of companies traded in Bombay grew from 10 in 1855 to 62 in 1862 and over 100 by 1864. The market crashed in May 1865 when the American Civil War ended and Back Bay Reclamation stock fell from 50,000 Rupees to 2,000. Bank of Bombay stock fell from 2,850 rupees to 87. Hundreds of time bargains matured on July 1, 1865 and many speculators were wiped out.
The stock brokers moved to Dalal (Brokers’) Street in 1874. The Bombay Stock Exchange was founded on July 9, 1875 as the Native Share and Stock Brokers Association and was the first stock exchange established in Asia. The Calcutta Stock Exchange incorporated in 1908. Stock exchanges opened up throughout India in the twentieth century. Nineteen former stock exchanges have closed in India since 2000. Today, most trading in Indian stocks takes place on either the Bombay Stock Exchange or the National Stock Exchange, founded in 1992. Both have a market cap of over $2 trillion.
GFD’s index for India uses data on the East India Co. exclusively from 1692 until 1845. A second East India Co. existed between 1698 and 1708, but it merged with the old East India Co. in 1708 because the competition between the two was eliminating their profitability. Data for the East India Railway begins in 1846 and the number of Indian companies that listed in London grew to 20 in the 1860s and peaked at around 50 in 1900. Data for India companies listed in London is used from 1690 to 1922. The number of companies remained around 50 until 1922 when a stock index based upon shares that traded in India was introduced. The domestic India index used data from 100 companies from the Calcutta, Bombay and Madras stock exchanges. By linking together data from The East India Co. from 1690 to 1845, the London Stock Exchange from 1846 to 1922 and from Indian stock exchanges from 1922 to the present, we have been able to provide over three centuries of data on stock companies that operated in India.
Railroads represented a majority of the capitalization in London during the 1800s. You can divide the role of railroads in India into four eras. Up until 1869, British companies constructed and managed the trunk lines that were built with the government providing guarantees on the shares. In the 1870s, the Government of India joined the private companies and began to construct and manage the railways. There were ten private companies incorporated in Britain, which built and managed the trunk lines through India. In the early 1880s, the Government of India began forming public-private partnerships with the Government of India becoming the majority owner of most of the railways in India. In addition to this, after the Afghan War of 1878, the government saw the benefit of building railroads for military use, not just for transporting freight and passengers. The government began to nationalize the railroads in 1924. In 1951, forty-two railways were consolidated into a single Indian Railway completing the nationalization of the nation’s railways.
The first railway was built in India in 1832 and the first passenger railroad opened in 1853 between Bombay and Thane. During the 1800s, about 90 percent of the shares were British-owned and almost all of the capital was raised through equity, not through bonds. The railroad network grew rapidly between 1880 and 1900 and by the early 1900s, India had the fourth largest rail network in the world. By 1900, India had 39, 834 kilometers of railways open, 10,000 more than was open in the United Kingdom, while China had only 1,000 kilometers of railways.
Most railroads received guarantees from the British government so that if their dividends fell below a certain level, usually 5%, the railroad could borrow money from the government to meet the guaranteed return. Because most railways were unable to achieve the 5% rate of return and had to borrow from the government year after year, the government had the right to acquire the railroad after 25 years of subsidies. The government acquired a share of ownership beginning in the 1880s and in the 1920s, most of the railroads were nationalized. The trade-off was that stock in the railways, which represented a majority of the capitalization of the stock market, traded like bonds. Shareholders received a guaranteed return, but railways lacked the incentive to maximize their profits, limiting increases in the price of railway stocks.
By the 1870s, the stock market capitalization of India exceeded its GDP, but as railroads were slowly nationalized, the market cap/GDP ratio continually shrank. The British government did not attempt to develop the Indian economy in the same way that development occurred in the United States, Canada and Australia. The British desire to control the Indian economy and focus on industries that could develop natural resources that could provide exports to Britain and the rest of the world hindered its economic growth. If anything, India deindustrialized in the 1800s as growth in the textile industry in England replaced the demand for textiles from India. Investment went into cotton, tea, and gold mining, all natural resources, but there was little attempt to develop industry in India. British control over the economy bred an anti-colonialism among Gandhi and other supporters of independence that led to socialist policies once India became an independent country after World War II. It wasn’t until the 1980s that India began to promote private business and the stock market began to rise again.
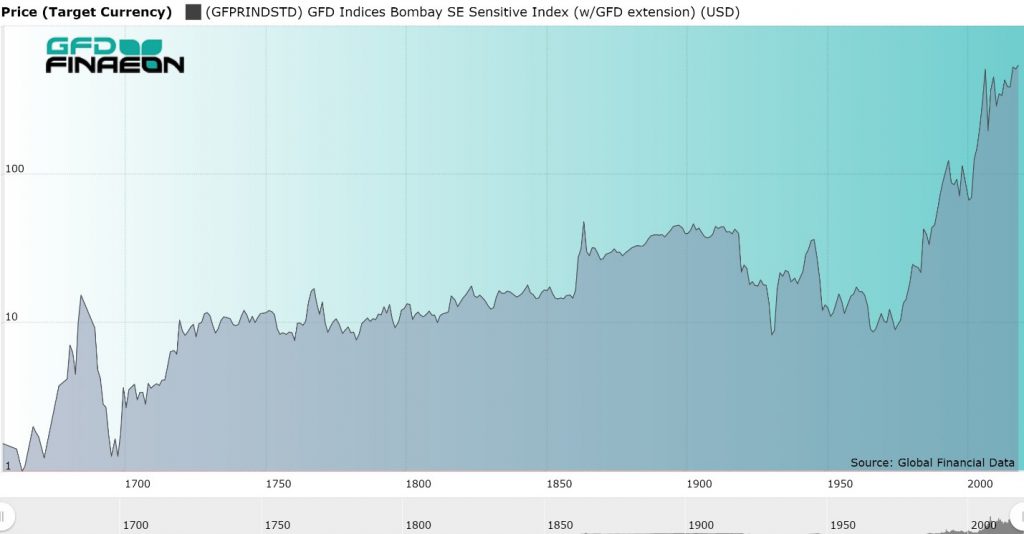
Figure 1. GFD India Price Index, 1657 to 2019
The performance of stocks in India over the past 350 years is illustrated in Figure 1. The most interesting observation here is the lack of movement in the index from the 1700s to 1980. All of the return to shareholders came in the form of dividends. This is the legacy of the guaranteed returns that first went to shareholders of East India Co. stock between 1792 and 1874, and to the railroads up until the 1890s. After the government gained control over the railways in the 1880s, investment went into tea, rubber, cotton, mining and other resources, not into industries that could develop the country. The ratio of the stock market’s capitalization to GDP shrank between 1880 and 1980 and investors had to rely upon dividends to obtain a return. Figure 2 shows the behavior of Indian stocks since the domestic index was first computed in 1920. As can be seen, there was virtually no change in the price of Indian stocks from 1920 until 1980. The Indian economy went through an economic boom between 1910 and 1930 and an economic bust between 1930 and 1950. After India became an independent country, the economy went through a period of economic boom driven by Five-Year plans and socialist policies leading to average growth in the economy of 3.1 percent per year. However, growth slowed between 1970 and 1990 leading to a period of economic liberalization which has prevailed in India since P.V. Narasimha Rao and Manmohan Singh introduced these reforms in 1991. This has given investors the opportunity to finally benefit from growth in the Indian economy. Today, there is investment in information technology as India tries to provide growth to over 1.3 billion people.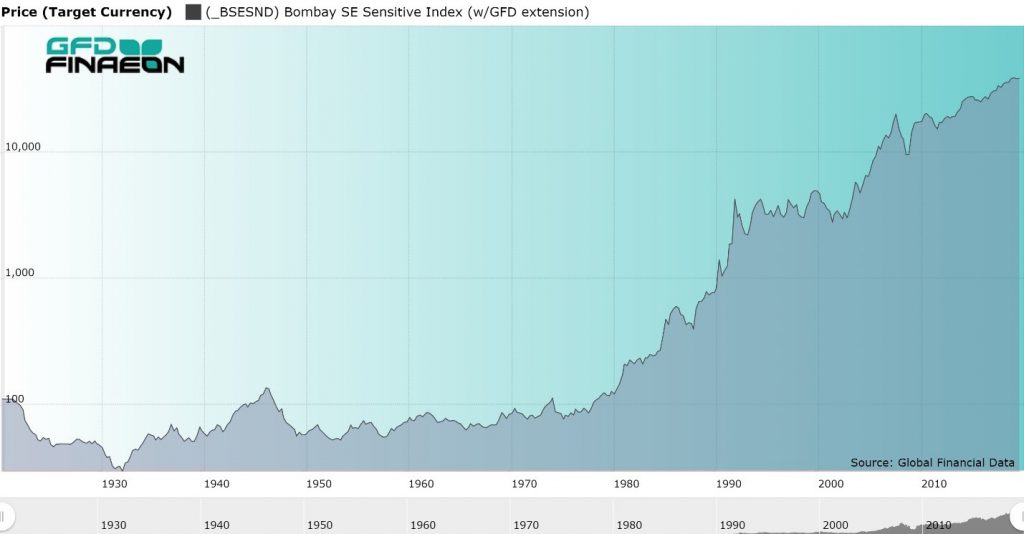
Figure 2. Domestic India Stock Price Index, 1920 to 2018
On the other hand, since India was a British colony, there was little risk of default on its outstanding bonds. Figure 3 provides a graph of the yield on Indian government bonds from 1722 until 2019. The series uses the yield on East India Co. stock from 1722 until 1864 when the Government of India issued its first bonds. The dividend was set at 10.5% in 1793 and remained at that level until the dissolution of the company in 1874. India issued a 4% bond in 1864 which was later replaced by bonds yielding 3.5% then 3%. Unlike many other emerging markets, India has never defaulted on its bonds, a fact that is reflected in the yield remaining around 4% until India’s independence. The yield rose to 14% in 1995 because of inflation, but has declined since then.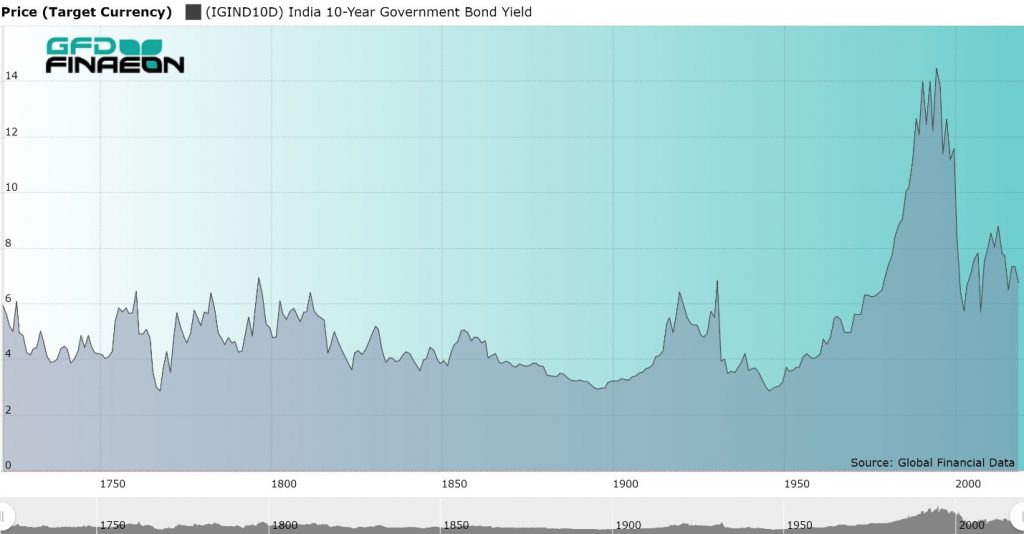
Figure 3. Yield on East India Co. Stock and India Government Bonds, 1722 to 2019
The actual numbers that measure the return to stocks and bonds in India is provided in Table 1. As can be seen, there was virtually no change in the price of Indian stocks between 1720 and 1980. The combination of a fixed dividend on East India Co. stock, guaranteed returns on Indian railroads, the deindustrialization of India and the focus on small, resource-based industries limited the opportunity for capital gains in India. Investors relied upon dividends as their source of income. During the past 200 years, Indian stocks have only provided a 4.16% annual return, barely 1% greater than bonds.| Period | Name | Stock Price | Stock Return | Bond Return | Premium |
| 1692-1720 | Glorious Revolution | 3.3 | 11.39 | ||
| 1720-1792 | Mercantilism | 0.11 | 5.1 | ||
| 1792-1848 | Transportation | 0.46 | 5.48 | ||
| 1848-1914 | Free Trade | 1.69 | 6.39 | 3.14 | 3.25 |
| 1914-1945 | World Wars | -0.68 | 4.79 | 5.4 | -0.61 |
| 1945-1981 | Keynesianism | -1.03 | 7.1 | 1 | 6.1 |
| 1981-2018 | Globalization | 8.79 | 12.45 | 2.92 | 9.53 |
| 1692-2018 | All History | 1.02 | 6.92 | ||
| 1822-2018 | Bond History | 0.38 | 4.16 | 3.14 | 1.02 |
Table 1, Returns to Stocks and Bonds in USD in India, 1692 to 2018
Conclusion
Mughal India was one of the most advanced areas of the global economy in the 1700s, exporting textiles and spices to Europe and the rest of the world. Under the British East India Co. and the British Raj, Britain developed India’s infrastructure, but it did not develop the economy. While the United States, Canada and Australia enjoyed dramatic increases in their GDP and investors received high rates of return, India stagnated. It has only been during the period of Globalization since 1981 that growth has returned to the country. India will soon have the largest population of any country in the world, but it may be several decades before India has the largest economy in the world.
Mexico has been struggling to develop its economy since Spain invaded Mexico in 1521 and it gained its independence in 1821. When Mexico was a colony, Spain relied upon exports of silver to profit from its control over the economy. The economy stagnated after Mexico gained its independence, but General Porfirio Diaz (1876-1910) attempted to develop the economy by allowing foreigners to invest in Mexico and build railroads and mines with foreign capital. Most of the investment in the 1910s and 1920s was spent developing Mexico’s oil, but after the nationalization of the oil industry in 1938, foreign capital stopped flowing into Mexico and the country had to rely on domestic capital. The economy grew rapidly after World War II, but collapsed in the 1980s. Since NAFTA was signed in 1994, Mexico has pursued market-oriented policies to expand trade with the rest of the world. The period between 1982 and 2007 was an era of high returns to both stocks and bonds, the highest in the country’s history, but during the past 12 years, returns have stagnated. Global Financial Data has 195 years of data on Mexico stretching from 1824 until 2019. GFD has data on 44 companies that listed in London and 30 companies that listed in New York between 1824 and 1989. Most of the companies that listed in London were mining companies, railroads, banks or oil and gas companies. Oil and gas, telephone and telegraph, utilities and mining companies listed in New York. Some of the companies had a long existence with the Anglo-Mexican Mint Co., Mexican Eagle Oil Co., Mexican Railway Co., and United Mexican Mine Co. all lasting over 50 years before meeting their demise. The poor performance of equities was matched by the poor performance of government bonds. Mexico was in default during most of the 1800s, paid interest from 1887 until World War I, went into default during the Mexican Revolution, then returned to solvency after World War II. Mexico defaulted on its bonds in 1827, made a few interest payments in the 1860s, but didn’t really start paying interest regularly until 1887. Mexico defaulted a second time in 1914 and remained in default until 1963 when the country issued new government bonds in New York. Mexico defaulted a third time in 1982 and remained in default until the “Brady plan” restructured Mexico’s debt in 1989. The Mexican government has been in default on its bonds in more years than it has paid interest. Mexican government bonds are definitely not risk-free. Even with the reinvestment of interest received periodically between 1824 and 1972, investors would have just broken even on Mexican government bonds during those 150 years. On the other hand, between 1994 and 2018, investors in Mexican bonds received an 8.73% annual return, which exceeded the 8.16% returned to equities during those years. British investment in Mexico began in 1824 when the Anglo-Mexican Mining Association, the United Mexican Mine Co. and the Mexican Mining Co. were established. These three companies were followed by The Company of Adventurers in the Mines of Bolaños, the Tlalpujahua Mining Co. and the Real del Monte Silver Mine Co. in 1825 and finally the Anglo-Mexican Mint in 1829. After an initial bubble in Mexican shares in 1825, shares lost over 90% of their value, reaching their nadir in 1876 as is illustrated in Figure 1.
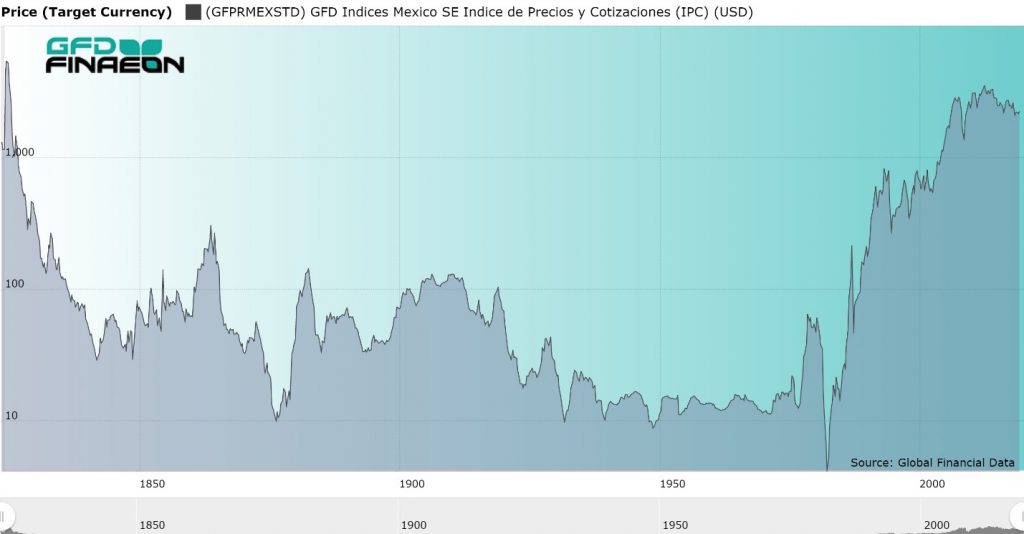
Figure 1. GFD Mexico Stock Price Index, 1824 to 2019 in USD
However, in 1876 General Porfirio Diaz became the leader of Mexico and allowed foreigners to invest in Mexico and build railways across the country. The Mexican Railway Co. was established in 1864, the Mexican Telegraph Co. in 1881, the Mexican National Railroad Co. in 1882 and the National Bank of Mexico in 1886. These companies rose in price, providing investors with a ten-fold return between 1876 and 1883. The Bolsa Mexicana de Valores was founded on October 31, 1894. During the 1910s and 1920s, foreign capital flowed from the United States into oil and gas companies. The Compañia Mexicana de Petroleo "El Aguila" S.A. (Mexican Eagle Oil Co. Ltd.) was one of the hottest stocks in both New York and London during the 1910s and 1920s (Figure 2). Speculators loved to trade the “Eagle” as it bounced up and down in the 1920s. However, the Constitution of 1917 gave the Mexican government control over its resources and in 1938, the oil industry was nationalized by the government and Petroleos Mexicano (PEMEX) was born.
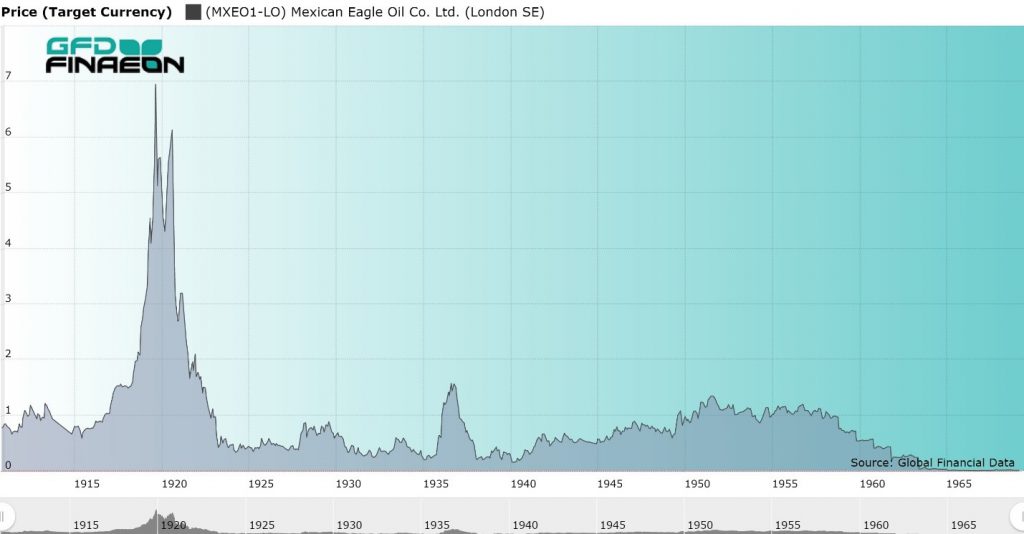
Figure 2. Mexican Eagle Oil Co. Ltd. Stock Price, 1911 to 1972
Although this gave Mexico possession of its oil industry, further investment of foreign capital in Mexico came to a halt. Mexico had to rely upon domestic investment and the stock market began a steady decline for the next 50 years. This occurred despite steady growth in Mexico between 1940 and 1970. The Nacional Financiera introduced an index of Mexican stocks in 1930. The index included 11 stocks in 1958 and expanded to 30 stocks in 1966 when daily calculations began. The Indice de Precios y Cotizaciones (IPC) was introduced in 1978 and includes 35 stocks. It is currently calculated by S&P. The Mexican stock market crashed during the Peso Crisis of 1982, losing two-thirds of its value in Pesos, and over 90% of its value in U.S. Dollars. Over the next twenty years, the market bounced back, rising over 98% per annum between 1982 and 1994 when NAFTA was signed. Stocks stagnated between 1995 and 1999, rose to 2006, but have stagnated since then. The return to equities in Mexico, as measured in US Dollars, is provided in Table 1. As can be seen, over the long term, investors have not been richly rewarded. Between 1824 and 1981, investors on average lost 4% per annum. All of the return to stocks has occurred since 1982 when the stock market bottomed out during the Peso Crisis. Unfortunately, only data on the price behavior of stocks is available for Mexico. Complete data on the return to stocks and bonds is not available because the dividend record for stocks is incomplete and the record on bond yields and returns is unavailable in the 1970s and 1980s. Nevertheless, we can provide data on stock prices over the past 195 years.
| Years | Era | Stock Price |
| 1848-1914 | Free Trade | 0.52 |
| 1914-1945 | World Wars | -4.44 |
| 1945-1981 | Keynesianism | 2.1 |
| 1981-2018 | Globalization | 11.65 |
| 1824-1981 | Pre-Globalization | -4.04 |
| 1824-2018 | Full History | -0.36 |
Table 1. Annual Returns to Mexican Stocks, 1824 to 2018
Mexican stocks and bonds provided horrible returns to shareholders between 1824 and 1981. Investors in both Mexican equities and Mexican government bonds lost money, even after the reinvestment of dividends and interest. Only since the collapse of the Peso in 1982 have investors been able to obtain positive returns. However, equity investors have broken even since 2007 as have investors in government bonds. Investors had 25 years of marvelous returns between 1982 and 2007, but returns have stagnated over the past dozen years. Distrust of the Mexican establishment led to the election of Andres Manuel Lopez Obrador in 2018. How his policies will impact the stock market in the future remains to be seen. Although the fabulous returns of the 25 years of Mexico’s investment miracle are unlikely to return, one can hope that Mexico does not return to the stagnation it suffered in the 60 years before 1982.
