 During the 1800s, the transport and finance sectors represented the majority of the stock market capitalization in the United Kingdom. As Figure 1 shows, in 1800, finance represented about 90% of stock market capitalization. This fell to around 60% in 1807 when data on canals became available, and 35% in the 1840s when the Railway Mania occurred. Similarly, transports represented about 30% of stock market capitalization between 1807 and the 1830s, rising to over 50% when the Railway Mania occurred in the 1840s. Transports represented about half of the stock market capitalization for the rest of the century. However, in 1924, Britain’s railways were merged into four main lines and after World War II, the railroads were nationalized. It was mainly after 1900 that sectors other than transports or finance began to play an important role in the British economy.
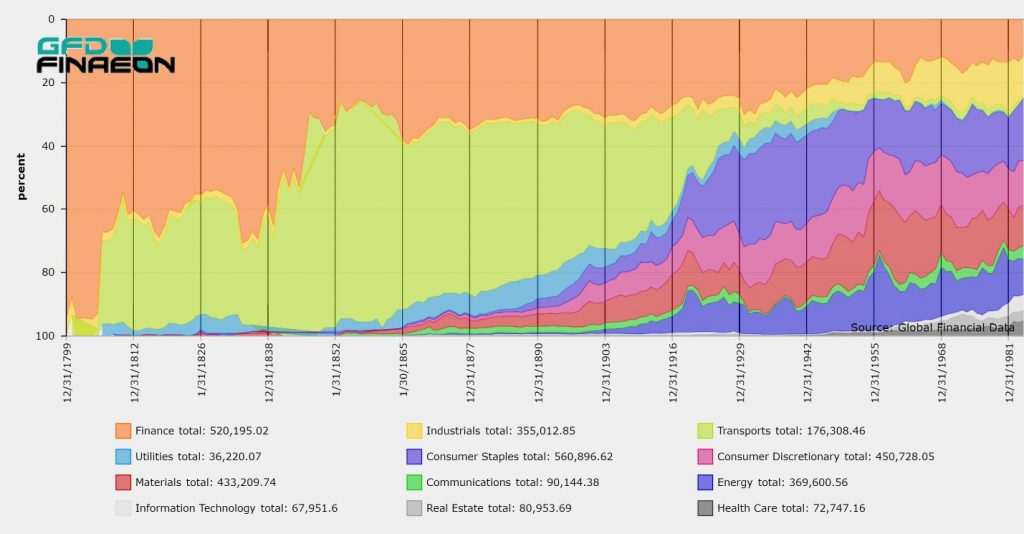
Figure 1. Shares of Stock Market Capitalization by Sector in the United Kingdom, 1800 to 1985
Figure 2 illustrates the performance of the Transport sector, the Finance sector and all stocks, as represented by the UK-100 in the 1800s. The most interesting fact revealed by the chart is the changing role of transport stocks in the 1800s. During the first 50 years, transports had more dramatic moves than the rest of the market, reflecting the speculative nature of investing in canals and railroads relative to the rest of the market. The Finance index mirrored the UK-100 index until 1840 because banks represented such a large portion of the total capitalization. Beginning with the Railway Mania of the 1840s, the UK-100 index no longer mirrored the performance of finance stocks. After 1850, transportation stocks represented about 60% of total market cap so there was a strong correlation between transports and the rest of the market. The UK-100 index had three bear markets in the 1800s between December 1809 and October 1812 (down 20.1%), between April 1824 and November 1831 (down 28.7%) and between June 1845 and April 1850 (down 34%). The Transport index had bear markets between June 1810 and October 1816 (down 41.2%), between October 1824 and November 1831 (down 36.2%), between July 1845 and April 1850 (down 57.3%), and between November 1852 and October 1855 (down 23.4%). Transport stocks also had more dramatic moves up in the 1820s (108% vs. 56.9%) and in the 1840s (69.1% vs. 36.3%) than the UK-100 index. As these numbers and Figure 2 reveal, transport stocks were more volatile than the rest of the market between 1807 and 1850.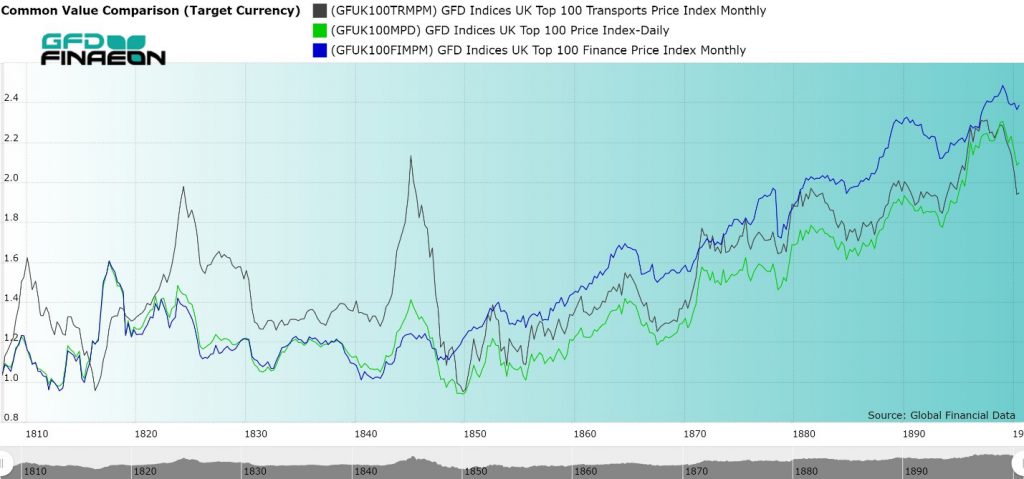
Figure 2. Transports, Finance and UK-100 Indices, 1807 to 1900
Four Transportation Bubbles
Transportation stocks went through four bubbles in the late 1700s and early 1800s. The first was the Canal Bubble of 1793. Canal stocks were issued in limited quantities to shareholders in the Midlands and the stocks were not really traded in London, so very little data exists on the price movements that occurred during the Canal Bubble; however, we do have data for some of the larger stocks, such as the Birmingham Canal, which shows that many of the stocks quadrupled in price before sinking back to par after the bubble ran its course. The second canal bubble occurred between 1806 and 1810. Luckily, we do have data on this bubble, at least the last three years of it. Canal stocks rose 65% between 1807 and 1810 before giving back all of the gains over the next five years. A third canal bubble occurred after the Napoleonic wars ended in 1815 and capital flowed to the canals to help rebuild the country. Similar bubbles in South American stocks and mining stocks also drove the market bubble in 1824 before stocks collapsed in 1825. Many of the South American mining stocks lost almost all of their value in the 1825 crash and South American countries that issued bonds in London ended up defaulting on their loans. The Railway Mania of the 1840s was the final transportation bubble of the 1840s. Hundreds of new railroads were registered and capital flowed into the new iron roads. The growth of the railroads came at the expense of the canals which declined in price while the price of railroads rose. Railroad companies used every technique they could think of to raise capital, issuing partial shares to lower the price and issuing preferred shares that received dividends before the ordinary shares got paid. Shares were issued at £100 par which was equal to a year’s salary for some people in the 1840s. So lowering the price of shares by dividing them into halves, fourths, tenths or even sixteenths enabled small investors to benefit from the Railway Mania and helped railroads to raise capital. The size of the transportation sector tripled between 1838 and 1846 rising to £60 million in market capitalization. When the Railway Mania ended in 1845, the railroads spent the next two decades picking up the pieces of their mad dash for capital. Fractional shares were converted into whole shares, smaller railways were taken over by larger railways, and shares that were below par were converted into full par shares through reverse splits. Shares in auxiliary railroads were converted into shares in the main company. After 1850, no more bubbles occurred in transportation stocks as the focus turned to consolidating the UK’s railways, not creating new ones. By the 1860s, the London and Northwestern Railway was not only the largest stock by capitalization in the United Kingdom, exceeding the size of the Bank of England, but the largest corporation in the world. The London and Northwestern held that title until the 1890s when Standard Oil became the largest corporation in the world. Railroads continued to consolidate until World War I, merged into four railroads in 1923 and were nationalized in 1946.One Hundred Years of Railways
Railway stocks not only transformed the stock market in the United Kingdom, but the rest of the world. In the United Kingdom, United States, France and other countries, railways attracted so much capital in the 1830s and 1840s that railways completely dominated trading in those countries. Railways were able to increase dividends dramatically as they grew, and shareholders saw the opportunity for long-term capital gains, not just steady dividends. In some ways, stock markets never recovered from the Railway Mania of the 1840s. Railway companies realized they could use aggressive techniques to take over other companies and expand their operations in a way that finance companies could not. Shareholders got the taste for capital gains and began focusing on buying companies that would not only pay rising dividends, but which would rise in price as well. The hundred years between the collapse of the Railway Mania in 1846 and the nationalization of the railways in Britain in 1946 was a century in which railways dominated the stock market in the United Kingdom. No industry will ever play as prominent a role in the British economy again. The House of Representatives has begun an inquiry into impeaching President Trump. This will make Trump only the fourth President to face an impeachment inquiry. Andrew Johnson was impeached in 1868, but the Senate failed to remove him from office by one vote. President Nixon faced impeachment in 1974, but resigned rather than be removed from office. President Clinton was impeached in 1998, but the Senate failed to remove him from office. Although there are sufficient votes to pass articles of impeachment against President Trump, since the Democrats have a majority of the seats in the House, because the Republicans control the Senate, it would be unlikely that President Trump would be removed from office.
While the stock market generally declined during the Watergate Hearings and the impeachment of President Nixon, the market rose during the impeachment and trial of President Clinton, but what happened during the impeachment of President Johnson? The S&P Composite as extended by the Cowles Commission only goes back to 1871, so no record of the performance of the market in 1868 exists. However, Global Financial Data has calculated a daily record of the stock market between 1830 and 1900 by calculating the GFD Railroad Index. Railroads represented most of the active stocks on the New York Stock Exchange in 1868. This index can reveal how the market reacted to the impeachment of President Johnson.
The House of Representatives has begun an inquiry into impeaching President Trump. This will make Trump only the fourth President to face an impeachment inquiry. Andrew Johnson was impeached in 1868, but the Senate failed to remove him from office by one vote. President Nixon faced impeachment in 1974, but resigned rather than be removed from office. President Clinton was impeached in 1998, but the Senate failed to remove him from office. Although there are sufficient votes to pass articles of impeachment against President Trump, since the Democrats have a majority of the seats in the House, because the Republicans control the Senate, it would be unlikely that President Trump would be removed from office.
While the stock market generally declined during the Watergate Hearings and the impeachment of President Nixon, the market rose during the impeachment and trial of President Clinton, but what happened during the impeachment of President Johnson? The S&P Composite as extended by the Cowles Commission only goes back to 1871, so no record of the performance of the market in 1868 exists. However, Global Financial Data has calculated a daily record of the stock market between 1830 and 1900 by calculating the GFD Railroad Index. Railroads represented most of the active stocks on the New York Stock Exchange in 1868. This index can reveal how the market reacted to the impeachment of President Johnson.
Impeachment!
The impeachment of Andrew Johnson was driven by differences between the Radical Republicans, who favored reconstruction, requiring southern states to enact new constitutions, ratify the Fourteenth Amendment and guarantee voting rights for black males and those who were sympathetic to the defeated rebels. Edwin M. Stanton was a staunch Radical Republican who had been appointed as Secretary of War under Abraham Lincoln and remained in office after Lincoln’s assassination. To ensure that Johnson did not get rid of Stanton, Congress passed the Tenure of Office Act in 1867 over Johnson’s veto. The Act required the President to seek the Senate’s advise and consent before removing any member of his Cabinet or any official who had required the Senate’s advise and consent before being appointed. Johnson suspended Stanton from office on August 5, 1867 and appointed Ulysses S. Grant in his place. The Senate reinstated Stanton in January 1868 and Grant resigned. On February 21, 1868, Johnson ordered the removal of Stanton from office and appointed Lorenzo Thomas as his successor. On February 24, the House of Representatives voted 126 to 47 to impeach President Johnson on eleven articles of impeachment. The Articles of Impeachment were presented to the Senate on March 4, 1868. The proceedings began on March 23 and the trial on March 30. At the time, there were 54 members of the Senate representing 27 states. The 10 Confederate states were not part of the Union. On May 16, the Senate voted on the Articles of Impeachment which required a two-thirds majority to pass and remove Johnson from office. Three Articles of Impeachment were voted on and each were passed by 35-19; however, this fell one vote short of the two-thirds requirement and Johnson was not removed from office. The vote weakened the President at the expense of the Congress, but the failure to remove Johnson from office reduced the likelihood that a President could be impeached for purely political reasons.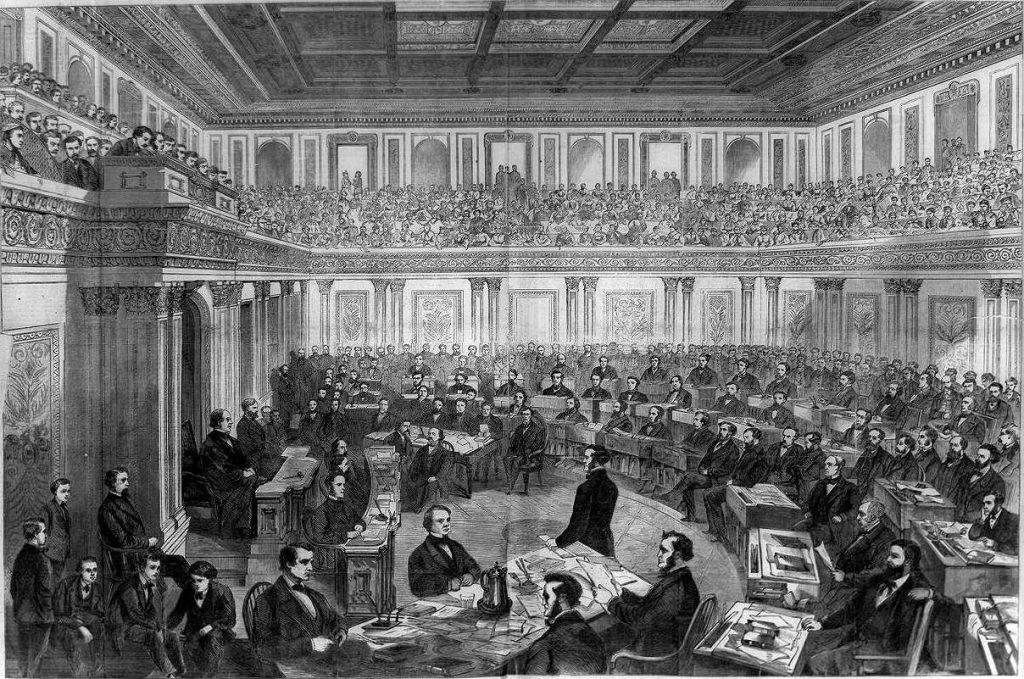
The Market
How did the stock market behave during the trial? The GFD Rail index had begun the year at 11.07 and had risen to 11.65 by the time that Johnson removed Stanton from office on February 21. The market actually rose in price between then and March 4 when the Articles of Impeachment were presented to the Senate. The market declined until April 20 when the Rail Index dipped below 11; however, the market recovered to 11.66 when the first Senate vote failed to remove Johnson from office, and to 11.89 when the second vote failed to remove Johnson from office. The market moved up from there, peaked on June 27, and declined after that.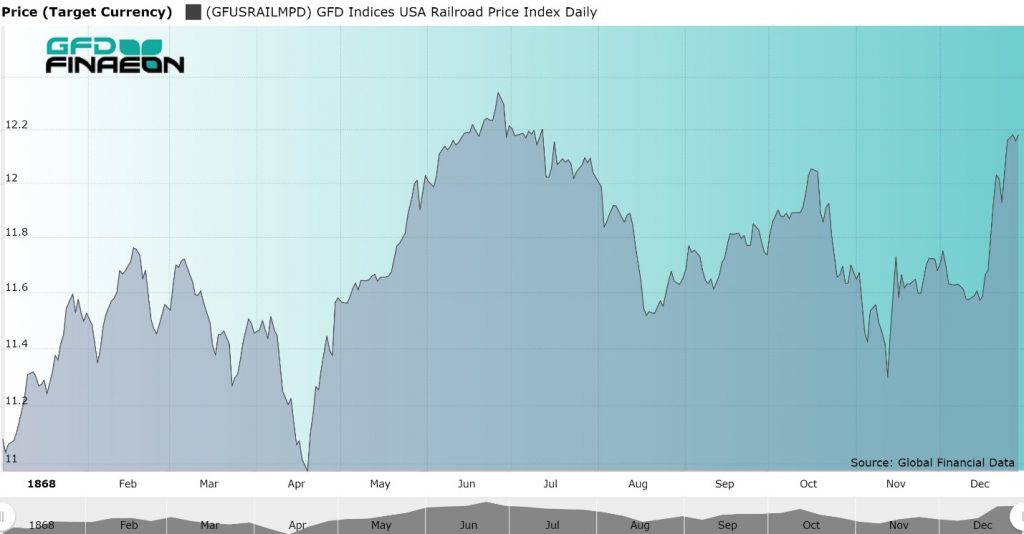 The failure to find Johnson guilty clearly impacted the stock market, driving it down in price while Johnson was on trial in the Senate, but rising in value as the Senate failed to remove him from office. The Tenure of Office Act was repealed by the Senate in 1887. As Lyman Trumball of Illinois, who voted for acquittal, noted, the failure to remove Johnson from office preserved one of the President’s most important rights – to disagree with Congress without there being any consequences.
Because President Johnson was opposed by the Radical Republicans, he did not receive any support at the Republican National Convention, and Ulysses S. Grant was chosen unanimously as the Republican candidate on the first ballot. Ulysses S. Grant went on to win the election in November and served as President for the next four years.
The failure to find Johnson guilty clearly impacted the stock market, driving it down in price while Johnson was on trial in the Senate, but rising in value as the Senate failed to remove him from office. The Tenure of Office Act was repealed by the Senate in 1887. As Lyman Trumball of Illinois, who voted for acquittal, noted, the failure to remove Johnson from office preserved one of the President’s most important rights – to disagree with Congress without there being any consequences.
Because President Johnson was opposed by the Radical Republicans, he did not receive any support at the Republican National Convention, and Ulysses S. Grant was chosen unanimously as the Republican candidate on the first ballot. Ulysses S. Grant went on to win the election in November and served as President for the next four years.
 Argentina just suffered one of the worst one-day declines in global stock market history. The current President of Argentina, Mauricio Macri, suffered a worse defeat in primary elections than was expected making it almost certain that his opponent Alberto Fernandez and his running mate, the former President of Argentina, Cristina Fernandez de Kirchner, will be elected as the leaders of Argentina and may gain a majority of seats in Argentina’s Congress. Fernandez took in 47% of the vote and Macri only 32%. Under Macri, Argentina borrowed $56 billion from the IMF and $34 billion is due in 2019. Argentina defaulted in both 2001 and in 2014. The fear is that once in power, Fernandez will undo the market-friendly austerity package that Macri imposed on Argentina, leading to a default on foreign bonds, worse inflation, and a collapse in the currency and the economy.
An article on Bloomberg inaccurately said that the decline in the Argentine stock market on August 11 was the second worst one-day decline in global stock markets since 1950. This statement was repeated by both Market Insider and The Economist. When we checked the data that Sarah Ponczek provided, we found no evidence of the other declines that Bloomberg listed in their Top 5. The “winner” was the Colombo All-Share Index which supposedly declined 61.7% in one day in 1989 due to the civil war in Sri Lanka. We found no evidence of this. The worst decline in Sri Lanka’s history was on November 5, 2003 when the market fell 12.98%. In reality, the range of the stock market for all of 1989 in Sri Lanka was 159.1 to 188.88, a range of 18.7%. So a one-day 61.7% decline was simply not possible. We found no large decrease for the Merval Index in 2002. The largest decline in 2002 was on February 11, 2002 when the market fell 10.7%, substantially less than the 45% Bloomberg reported. Similarly, when we investigated the Kazakhstan Stock Exchange index in 2002, we did find a 38% decline, but only because of a bad data print, not because of an actual decline. Where Bloomberg got their bad data from, we do not know.
What we did find, however, was that there was a decline in the Merval index that exceeded Monday’s decline. On January 8, 1990, the Merval Index fell 53.1%. As far as we can tell, this was the greatest one-day decline in global stock market history. The market had been closed between December 28, 1989 and January 8, 1990, so there were ten days of “catch up” adjustment, but the decline was huge. If you look at the Argentina General Index (IBG) which includes all shares listed on the Buenos Aires stock exchange, the market declined “only” 44%. The market bounced back on January 9, 1990 with the Merval index rising 22.9% and the IBG increasing 13.9%.
So what was going on to cause the crash in 1990? Hyperinflation. Consumer prices increased 79% in the month of January 1990. Prices doubled in March 1990. Hyperinflation was destroying the economy, but stock prices had to rise in line with inflation. Figure 1 shows the performance of the Argentine index between1988 and 1991 after adjusting for inflation. As you can see, after inflation, Argentine stocks lost 90% of their value between mid-1989 and the end of 1990, an abysmal return.
And of course, hyperinflation works both ways. The Merval index recorded three 30% plus days in 1989 at the height of its hyperinflation, rising 30% on May 30, 1989, 33.67% on December 27, 1989 and 39.35 on May 31, 1989. That produced a cumulative 81% increase on May 30 and May 31, 1989. That is a good return even when there is hyperinflation!
Argentina just suffered one of the worst one-day declines in global stock market history. The current President of Argentina, Mauricio Macri, suffered a worse defeat in primary elections than was expected making it almost certain that his opponent Alberto Fernandez and his running mate, the former President of Argentina, Cristina Fernandez de Kirchner, will be elected as the leaders of Argentina and may gain a majority of seats in Argentina’s Congress. Fernandez took in 47% of the vote and Macri only 32%. Under Macri, Argentina borrowed $56 billion from the IMF and $34 billion is due in 2019. Argentina defaulted in both 2001 and in 2014. The fear is that once in power, Fernandez will undo the market-friendly austerity package that Macri imposed on Argentina, leading to a default on foreign bonds, worse inflation, and a collapse in the currency and the economy.
An article on Bloomberg inaccurately said that the decline in the Argentine stock market on August 11 was the second worst one-day decline in global stock markets since 1950. This statement was repeated by both Market Insider and The Economist. When we checked the data that Sarah Ponczek provided, we found no evidence of the other declines that Bloomberg listed in their Top 5. The “winner” was the Colombo All-Share Index which supposedly declined 61.7% in one day in 1989 due to the civil war in Sri Lanka. We found no evidence of this. The worst decline in Sri Lanka’s history was on November 5, 2003 when the market fell 12.98%. In reality, the range of the stock market for all of 1989 in Sri Lanka was 159.1 to 188.88, a range of 18.7%. So a one-day 61.7% decline was simply not possible. We found no large decrease for the Merval Index in 2002. The largest decline in 2002 was on February 11, 2002 when the market fell 10.7%, substantially less than the 45% Bloomberg reported. Similarly, when we investigated the Kazakhstan Stock Exchange index in 2002, we did find a 38% decline, but only because of a bad data print, not because of an actual decline. Where Bloomberg got their bad data from, we do not know.
What we did find, however, was that there was a decline in the Merval index that exceeded Monday’s decline. On January 8, 1990, the Merval Index fell 53.1%. As far as we can tell, this was the greatest one-day decline in global stock market history. The market had been closed between December 28, 1989 and January 8, 1990, so there were ten days of “catch up” adjustment, but the decline was huge. If you look at the Argentina General Index (IBG) which includes all shares listed on the Buenos Aires stock exchange, the market declined “only” 44%. The market bounced back on January 9, 1990 with the Merval index rising 22.9% and the IBG increasing 13.9%.
So what was going on to cause the crash in 1990? Hyperinflation. Consumer prices increased 79% in the month of January 1990. Prices doubled in March 1990. Hyperinflation was destroying the economy, but stock prices had to rise in line with inflation. Figure 1 shows the performance of the Argentine index between1988 and 1991 after adjusting for inflation. As you can see, after inflation, Argentine stocks lost 90% of their value between mid-1989 and the end of 1990, an abysmal return.
And of course, hyperinflation works both ways. The Merval index recorded three 30% plus days in 1989 at the height of its hyperinflation, rising 30% on May 30, 1989, 33.67% on December 27, 1989 and 39.35 on May 31, 1989. That produced a cumulative 81% increase on May 30 and May 31, 1989. That is a good return even when there is hyperinflation!
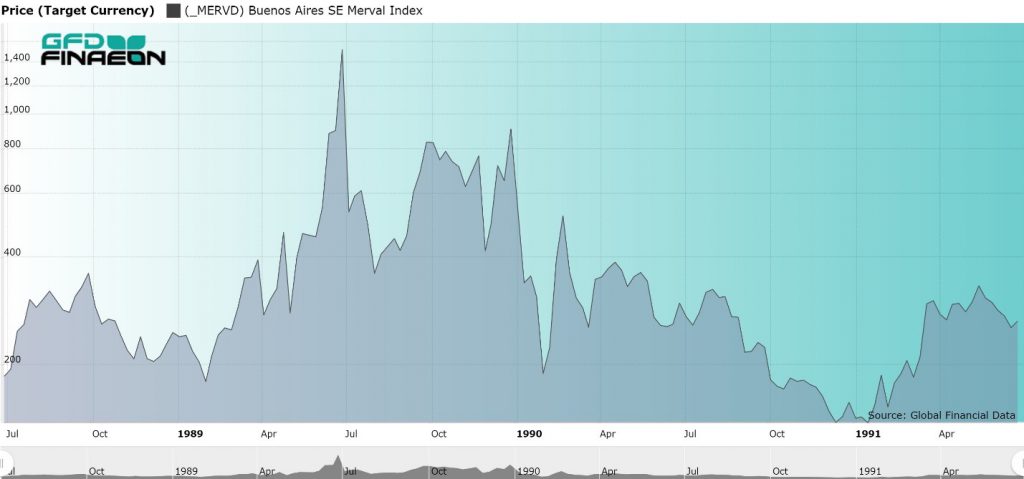
Figure 1. Argentina Merval Index Adjusted for Inflation, 1988 to 1991
Similar stock market volatility occurred during the hyperinflation of 1976. The market declined 29% on March 19, 1976 and 18.2% on June 14, 1976. What is interesting is that all the past declines occurred during periods of hyperinflation. On the other hand, August 12’s decline was purely event-driven, caused by election results that could portend a return to high inflation and a possible default in Argentina. Nevertheless, on August 13, the Argentine market bounced back, rising 10% in one day. However, the Argentine Peso continued to decline falling to 60 on August 14 from 45 on August 11. Investors are expecting the worst from the elections due October 27. Fernandez has maintained his lead and it seems likely that he will become the next leader of Argentina. Macri’s attempt to bring Argentina back into the international financial system has apparently failed. Back in the 1920s, Argentina was one of the ten richest countries in the world as measured by GDP per capita, but since the 1940s, Peronist policies have caused stagnation and inflation that has pushed Argentina’s per capita income down to where it barely makes the top 50 today. Unless Argentina can get its economy moving again, it is likely to fall further. Brazil went through an economic bubble in the 1880s that burst in the 1890s during the first Brazilian military dictatorship. Two finance ministers in Brazil adopted a policy of unrestricted credit for industrial investments in the 1880s. This led to speculation, fraudulent IPOs, inflation and ultimately, a crash that lasted from 1889 to 1893.
Saddle Up
The word “encilhamento” means to saddle up or mount a horse and refers to jumping on a get-rich-quick scheme. Brazil had slowly industrialized during the 1800s and founded corporations that developed rail transport, gas lighting, banks and steamships. The “Land Law” of 1850 and the “Barriers Act” of 1860, which limited access to agricultural land by slaves and immigrants, had held back the country’s growth. Under the Encilhamento, big rentiers were better able to invest their money where it provided the highest rate of return. Merchants, businessmen, financiers, politicians and tradesmen could invest their money in either local companies or in Brazilian companies that listed in Paris or London. A new banking act was passed in 1888 which reversed the 1860 Barriers Act, and in the same year, slavery was abolished after a long campaign by Emperor Pedro II. Changes in the Land and Real Estate Law occurred in 1889. Government debt fell, reducing the issuance of government bonds and freeing up capital to flow into equities. With all of these positive changes, stock prices in Rio de Janeiro started to boom. On November 15, 1889, a military coup d’etat established the first Brazilian Republic. It overthrew the constitutional monarchy of the Empire of Brazil and Emperor Pedro II. Unfortunately, this also marked the apex of the bull market and the Brazilian stock market declined over the next four years. Ruis Barbosa was appointed the new Finance Minister under the Republic, and he instituted many of the changes he had promised to pop the bubble. This included introducing a new banking bill and introducing a Central Bank to regulate the money supply.The Baring Crisis
During the 1880s, there were huge capital flows from London into South America with the current account deficit of Argentina averaging 20% of GDP between 1884 and 1889. During those years, the Argentine money supply grew at the rate of 18% per year, inflation averaged 17% and the paper peso depreciated at the rate of 19% per annum. By the end of the decade, Argentina was the fifth largest sovereign borrower in the world; 40% of foreign borrowing was going toward debt service and 60% of imports were for consumption goods. Argentina defaulted on £48 million in debt in 1890. The military tried to overthrow the Argentine government on August 6, 1890, but failed. After the crisis hit, real GDP in Argentina fell by 11% in 1890 and 1891. The collapse this caused in the price of Argentine sovereign bonds that resulted is illustrated in Figure 1.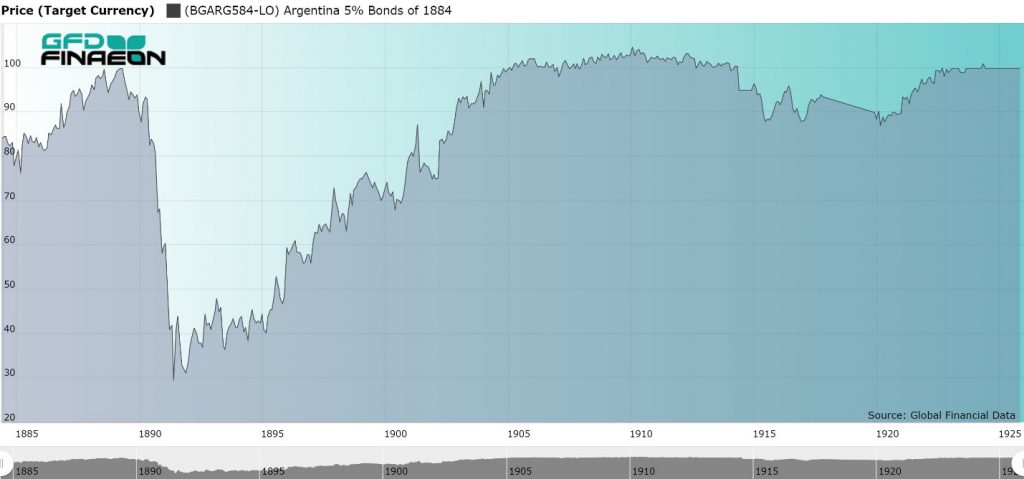 Figure 1. Argentina 5% Bond of 1884, 1884 to 1925
Figure 2. Brazil 4.50% Bond of 1883
As the Baring Crisis spread throughout South America, the bubble that had built up in Brazil burst. This led to a steady decline in equity prices in the years that followed. Brazilian share price steadily declined from 1889 to 1893 as is illustrated in Figure 3.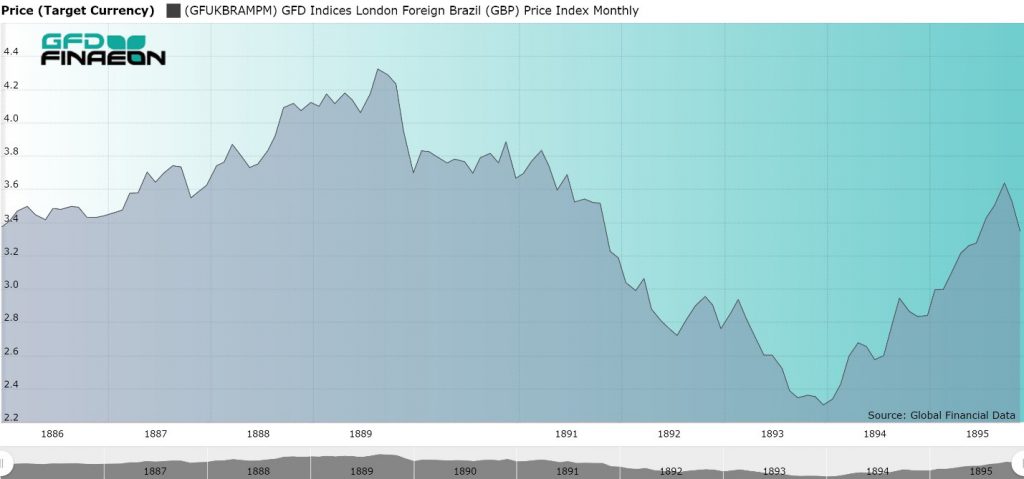
Figure 3. Brazil Stock Price Index, 1885 to 1895
The Baring Crisis led to a world-wide depression which, although it was not as severe as some of the other depressions of the 1800s, affected Europe, the United States and South America. Argentina, Brazil and Uruguay were all affected by Argentina’s default and the Baring Crisis that followed. The crisis spread to South Africa and Australia, and in the United States. The global economy suffered throughout the 1890s. No country was left unaffected. Brazil may have suffered from the Great Depression of the 1890s, but so did every other country in the world.