
25 years ago: August 1994
S&P 500: 475.49 (vs. 2918.65 in 08/2019) 10-year U.S. Government Bond Yield: 7.19% (vs. 1.74% in 08/2019) Gold: $385.75 (vs. $1497.35 in 08/2019) Oil: $17.595 (vs. $54.41 in 08/2019) GBP/USD: 1.5345 (vs. 1.2022 in 08/2019) US GDP: $7,247 billion (vs. $21,338 billion in 06/2019) US Population: 260 million (vs. 328 million in 2019) 08/02/1994: First Chechen War: The leader of the Russian-backed Provisional Council of the Chechen Republic announced his intention to overthrow the Dudaev government. 08/15/1994: The Bosnia New Dinar replaced the Bosnia Dinar at the rate of 1 Bosnia New Dinar equal to 10,000 Bosina Dinar. 08/16/1994: The Federal Reserve pushes up short-term interest rates by one-half percentage point. Many big banks raise their prime lending rates in response. 08/24/1994: Initial accord between Israel and the PLO about partial self-rule of the Palestinians on the West Bank. 08/30/1994: Lockheed and Martin Marietta agree to merge in plan valued at more than $10 billion. 08/31/1994: The Provisional Irish Republican Army declares a ceasefire.50 years ago: August 1969
S&P 500: 95.51 (vs. 2918.65 in 08/2019) 10-year U.S. Government Bond Yield: 6.83% (vs. 1.74% in 08/2019) Gold: $40.86 (vs. $1497.35 in 08/2019) Oil: $3.21 (vs. $54.41 in 08/2019) GBP/USD: 2.3812 (vs. 1.2022 in 08/2019) US GDP: $1,009 billion (vs. $21,338 billion in 06/2019) US Population: 205 million (vs. 328 million in 2019) 08/04/1969: Vietnam War: At the apartment of French intermediary Jean Sainteny in Paris, American representative Henry Kissinger and North Vietnamese representative Xuan Thuy begin secret peace negotiations. The negotiations will eventually fail. 08/08/1969: At a zebra crossing in London, photographer Iain Macmillan takes the photo that becomes the cover of the Beatles album Abbey Road. 08/09/1969: Followers led by Charles Manson murder pregnant actress Sharon Tate (wife of Roman Polanski), coffee heiress Abigail Folger, Polish actor Wojciech Frykowski, men's hairstylist Jay Sebring and recent high-school graduate Steven Parent. A day after murdering Sharon Tate and four others, members of Charles Manson's cult kill Leno and Rosemary LaBianca. 08/13/1969: The Apollo 11 astronauts are released from a three-week quarantine to enjoy a ticker tape parade in New York, New York. That evening, at a state dinner in Los Angeles, California, they are awarded the Presidential Medal of Freedom by U.S. President Richard Nixon. 08/14/1969: Operation Banner: British troops are deployed in Northern Ireland. 08/15/1969: Woodstock rock and roll concert opens. 08/28/1969: Florida East Coast Industries Inc. (formerly Florida East Coast Railway Co.) added to the Dow Jones Transportation Average100 years ago: August 1919
S&P 500: 8.765 (vs. 2918.65 in 08/2019) 10-year U.S. Government Bond Yield: 4.78% (vs. 1.74% in 08/2019) Gold: $20.67 (vs. $1497.35 in 08/2019) Oil: $4.00 (vs. $54.41 in 08/2019) GBP/USD: 4.2 (vs. 1.2022 in 08/2019) US GDP: $84 billion (vs. $21,338 billion in 06/2019) US Population: 104 million (vs. 328 million in 2019) 08/07/1919: Discount houses raise their rate for deposits at notice to 3 1/4 percent, but the banks made no change in their published rates. Revised figures of cash applications to Funding Loan and Victory Bonds issued. Amount subscribed to Funding Loan, 287,956,000; Victory Bonds, 286,748,000. 08/11/1919: Andrew Carnegie dies. The constitution of the Weimar Republic is adopted. 08/14/1919: The Romanian army left the Hungarian capital, Budapest. Admiral Mikls Horthy stepped into the power vacuum with the army of the Krolyi government. 08/19/1919: Afghanistan gains full independence from the United Kingdom. 08/23/1919: Treasury restrictions on movement of capital withdrawn. American exchange quoted at $4.10 to the 1. 08/25/1919: Polish-Soviet War: After its total occupation by Polish forces, the Lithuanian-Byelorussian SSR was dissolved. 08/31/1919: United States Public debt hits $26,600,000,000. $240 per Capita.200 years ago: August 1819
S&P 500: 1.5668 (vs. 2918.65 in 08/2019) 10-year U.S. Government Bond Yield: 4.545% (vs. 1.74% in 08/2019) Gold: $19.39 (vs. $1497.35 in 08/2019) GBP/USD: 4.48 (vs. 1.2022 in 08/2019) US GDP: $727 million (vs. $21,338 billion in 06/2019) US Population: 9.379 million (vs. 328 million in 2019) 08/06/1819: Norwich University is founded in Vermont as the first private military school in the United States. 08/07/1819: Battle of Boyac Known in Colombia as Battle of Boyac Bridge. (Batalla del puente de Boyac) Simn Bolvar and his brigadier generals Francisco de Paula Santander and Jose Antonio Anzotegui defeat and capture royalist Colonel Jose Maria Barreiro in the battle sealing the independence of Nueva Granada, now Colombia. 08/16/1819: Peterloo Massacre: Seventeen people die and over 600 are injured in cavalry charges at a public meeting at St. Peter's Field, Manchester, England. 08/17/1819: New Zealand's second mission station is established, at Kerikeri, when Rev Marsden, John Butler, Francis Hall and William Hall mark out the site which was previously visited by Marsden in 1815.GFD has calculated a global index of stocks that begins in 1602 and continues until the present. With this index, we can track the changes in global stock markets over the past 400 years, determine when bear markets occurred and study the causes of those bear markets.
We have already shown that you can divide up the history of equity markets into four eras: the period of Mercantilism (1600-1799) during which a few international trade companies dominated stock exchanges, Free Trade (1800-1914) during which railroads, finance and other industries grew in size, Regulation (1914-1981) during which government regulation and nationalizations restricted the growth of global stock markets, and Globalization (1981-) during which markets once again became a source of capital for global corporations.
GFD defines a bear market as a 20% decline in the price of stocks following a bull market in which prices increase by at least 50%. GFD’s World Index measures the behavior of global stocks in British Pounds up until 1914 and U.S. Dollars since then. There were six bear markets in the 1600s, five bear markets in the 1700s, only one real bear market in the 1800s, nine bear markets in the 1900s and so far, two bear markets in the 2000s. This gives us a total of 23 global bear markets over the past 417 years.
Although people are familiar with the bear markets of the 1900s and 2000s, there is almost no research on bear markets in the 1700s and 1800s, primarily because no data has existed to measure these global bear markets. Another blog, “A Century of War: Bear Markets in the 1700s” explored the bear markets that occurred in the 1700s showing how European wars drove the bear markets of that century. The 1800s, on the other hand, were a century of peace. There were no major European wars between the end of the Napoleonic Wars in 1815 and the start of World War I in 1914. This freed up capital to invest in railroad, finance and other companies that dominated financial markets. Between 1815 and 1914, Britain’s government debt declined, but the capitalization of the British stock market grew from $250 million to $15 billion and the capitalization of the United States’ stock markets grew from $50 million to $20 billion.
The question this raises is why were bear markets so rare in the 1800s? Bear markets occur about once a decade. The longest global bear market in history occurred after the collapse of the South Sea Bubble in 1720 and lasted for 42 years. However, the 1800s had two very long bull markets lasting from 1797 until 1845 and from 1848 until 1912. It was the combination of the collapse of the railway mania and the Revolution of 1848 in France that created the only bear market in the 1800s.
Although there were numerous corrections in global stock markets driven by Panics in 1819, 1825, 1837, 1847, 1857, 1866, 1869, 1873, 1882, 1884, 1893 and 1896, global stock markets were not integrated in the same way they were in 1987. Corrections occurred rather than bear markets. A list of the major panics in the 1800s is provided in Table 1.
| Panic | Country | Cause |
| 1819 | United States | Speculative Land Deals |
| 1825 | Great Britain | Collapse of Banks and South American Stocks |
| 1837 | United States | Bank of the United States Battle |
| 1847 | Great Britain | Railway Mania and French Revolution |
| 1857 | United States | Failure of Ohio Life Insurance and Trust |
| 1866 | Great Britain | Collapse of Overend, Gurney and Co. |
| 1869 | United States | Black Friday Collapse of Gold Market |
| 1873 | USA, Austria | Collapse of Jay Cooke & Co., Vienna Stock Market Crash |
| 1882 | France | Collapse of l’Union Generale |
| 1884 | United States | Collapse of Grant and Ward and Marine National Bank |
| 1893 | USA, Britain | Collapse of Baring Brothers, Bank Failures |
| 1896 | United States | Gold Standard Problems |
Table 1. Major Panics in the 1800s
The 1845 to 1848 bear market is illustrated in Figure 1 which shows the performance of stock indices for the United States (black), France (green), Germany (blue) and the United Kingdom (brown). The largest decline came from stocks in France, but the majority of the capitalization for the index came from stocks in the United Kingdom.
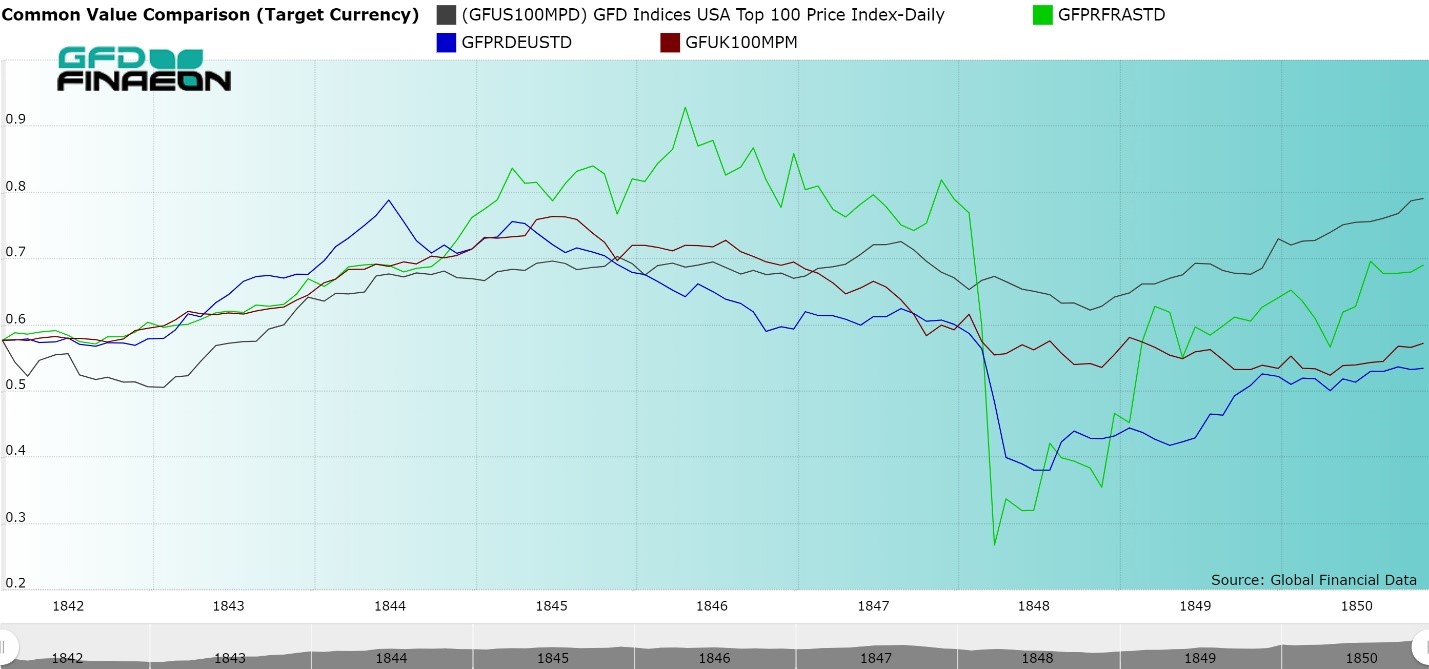
Figure 1. Stock Indices for the United States, France, Germany and the United Kingdom, 1841-1850
Bear Markets in Individual Countries
In 1800, there were only four stock markets in the world, located in London, Amsterdam, Paris and the United States. During the 1800s, stock markets were founded in every major country in the world, and by the end of the 1800s, data from over a dozen countries was available for the world stock index. Although there was only one global bear market in the 1800s, individual countries endured more than one bear market between 1800 and 1900.
Britain had bear markets between April 1802 and August 1803 (down 31.5%), between November 1809 and November 1812 (down 20.6%), and between January 1825 and October 1848 (down 37.2%). The London Stock Exchange then had a 51-year bull market run between 1848 and May 1899 whence the market declined by 37% to October 1915. Hence, there were only three bear markets in London during the 1800s.
France suffered several more bear markets than the United Kingdom in the 1800s. There was really only one stock that traded in France until the 1830s, and that was the Banque de France. The stock suffered 20% or greater declines in 1803, from 1807 to 1814, in 1815 after the defeat of Napoleon and between 1825 and 1831. After railroads began dominating the French stock market in the 1830s, there were bear markets between July 1840 and March 1848 (down 58%), between May 1856 and March 1871 (down 33.6%) and between December 1881 and May 1887 (down 20%).
If you look at Germany, you find six bear markets between June 1844 and June 1848 (down 51.1%), between May 1853 and April 1854 (down 25.3%), between May 1856 and June 1859 (down 27%), between November 1872 and June 1877 (down 64%), between December 1889 and November 1891 (down 31.5%), and between May 1899 and October 1901 (down 26.4%).
The data for the United States is quite interesting because the United States suffered its longest bear market in the early 1800s. Between January 1792 and January 1843, the US-100 index declined by 66.8%. Finance companies dominated the stock exchanges, and because of state-imposed restrictions, banks and insurance companies had few opportunities for growth. Although stocks on average declined in price by 1% per annum between 1792 and 1843, stocks provided a dividend yield of 5% generating a positive total return of 4% per annum. The Panic of 1857 sent the U.S. stock market into a tailspin between August 1853 and October 1857 (down 33.7%). The decline between July 1864 and October 1873 was largely a result of the deflation following the Civil war when the stock market declined by 34.4%. A final bear market occurred between May 1881 and January 1885 when the stock market fell by 34.6%.
What is important to notice here is the lack of coordination between the bear markets in London, Paris, Berlin and the United States. Today, as soon as a decline occurs in one market, it is transmitted to other markets throughout the world in hours. This simply wasn’t the case in the 1800s before the telegraph could transmit information around the world. Markets moved independently of one another and although there was some coordination, it was limited.
In addition to this, London represented a majority of the world’s market capitalization in the 1800s, so changes in London drove changes in the global stock market. London didn’t have a bear market between 1848 and 1899 so neither did the World Stock Index.
The World Index, measured in British Pounds, is illustrated in Figure 2. As can be seen, the only bear market during the 1800s occurred between July 1845 and November 1848 when the index declined by 31%. There were a number of corrections in the index of 10% or more at different points in time, but no bear markets with a decline of 20% or more.
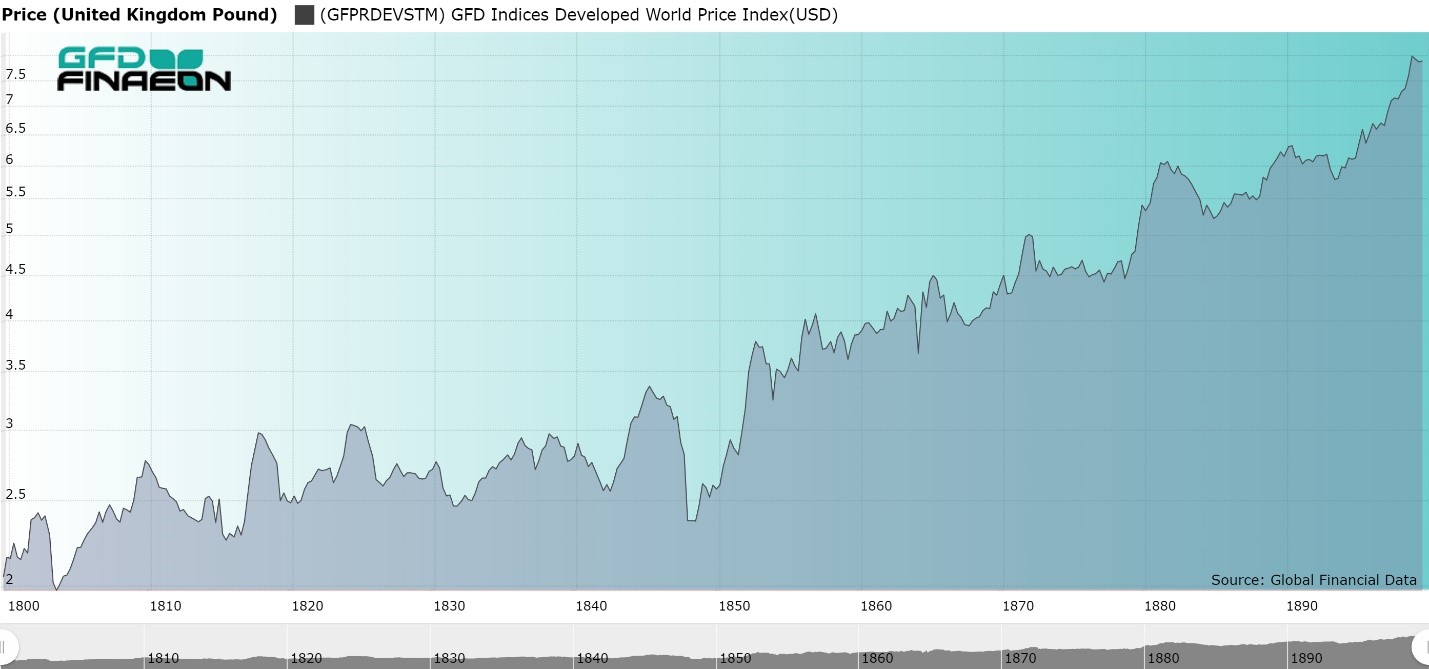
Figure 2. GFD World Index in GBP, 1800 to 1900
Of course, in July 1914, World War I began. During the 1900s, the world suffered bear markets between August 1912 and July 1921 (down 39.9%), August 1929 and June 1932 (down 75.4%), February 1937 and May 1940 (down 39.9%), May 1946 and September 1949 (down 26.3%), November 1968 and June 1970 (down 25.5%), March 1973 and September 1974 (down 43.4%), April and August 1982 (down 26.5%) August and November 1987 (down 23.7%) and between January and September 1990 (down 25.9%). Bear markets shortened in time but became more frequent during the 1900s.
It should also be noted that the coordination of financial markets improved over the course of the twentieth century. A decline in stocks in the United States usually led to a decline in stocks in other countries. It no longer took days or weeks for a decline in London or New York to influence other stock markets, but hours. The declines in the first half of the 1900s were driven by World War I and World War II. By the end of the 1900s, financial panics and recessions became the main drivers of global bear markets.
War, Peace and Financial Markets
Stock markets have gone through many fundamental changes over the past 400 years. During the 1700s, there was a handful of international trading companies that dominated stock markets in Amsterdam, London and Paris. Investors primarily bought stocks for their dividends and prices largely remained unchanged, except when a war came along imposing losses on investors. While the 1700s were a century of war in which government debt grew dramatically, but stock market capitalization grew slowly, the 1800s were the opposite. There were no major wars in Europe between 1815 and 1914 and stock markets grew rapidly. Government debt declined during those 100 years, but stock market capitalization increased in size. There was only one major bear market in the entire century. When war returned to the continent in 1914, government debt soared, market capitalization shrank as a share of GDP, and bear markets returned.
One wonders what would have happened if the 1700s had been a century of peace or the 1800s had been a century of war. Would stock markets have expanded in the 1700s as they did in the 1800s? Would the industrialization of the economy have been delayed if wars had plagued the European continent in the 1800s? And what about the world in the 1900s? What if World Wars I and II had never occurred? How different would our world have been today? China, India and Russia would have industrialized faster and been an integral part of the global economy in a way they weren’t when socialism dominated their economies.
And what about the twenty-first century? Will it be a century of war? A century of peace? Will emerging markets become developed markets? Will financial panics or wars drive the bear markets of the next 100 years? Only time will tell.

At about $1 trillion, Brazil’s stock market is among the twenty largest stock markets in the world, equal to about half of the country’s GDP. The first stock exchange opened in Brazil in 1817, the Rio de Janeiro Stock Exchange opened in 1820, and the Sao Paulo Stock Exchange opened in 1890. Brazilian stocks began listing in London in 1825 when three Brazilian mining companies took advantage of London’s interest in South America to list their shares. Between 1825 and 1985, 65 Brazilian companies listed in London.
Despite this long history, Brazil is an emerging market for which it is difficult to provide an accurate, long-term stock index because of the inflation that wrecked the economy in the late 1900s. Between 1967 and 1994, Brazil went through five currencies and inflation averaged over 182% per annum, with inflation exceeding 1000% each year between 1988 and 1994. In February 1990, interest rates hit a daily rate of 3.626%, which works out to over 790,000% per annum. The debt market for bonds and bills became almost non-existent. Brazil was finally able to tame its inflation addiction in 1994 when it replaced the Cruzeiro with the Real. As a result of decades of inflation, it took 2.75 quintillion (2,750,000,000,000,000,000) reis of the 1800s to obtain 1 real of money today. Even since the currency was stabilized in 1994, the stock market has continued on a roller coaster ride. How could an economy or stock market function under such circumstances?
Brazilian stock index data is available since 1954 when the SN Index which used companies from both the Rio de Janeiro and Sao Paulo stock exchanges was introduced. An index for Rio began in 1955 and the Bovespa index from Sao Paulo starts in 1968. Since Brazilian stocks have traded on the London Stock Exchange since 1825, we can calculate an index of London shares and append this index onto the Bovespa to create an index of Brazilian shares that stretches from 1825 until today.
Among the more prominent Brazilian companies that listed in London were the Brazilian Traction, Light and Power Co. (later renamed Brascan), which existed between 1912 and 1997, the General Mining Association, which existed between 1825 and 1900, the Rio de Janeiro City Improvement Co, which listed from 1862 to 1930, the Sao Paulo Railway Co, which existed between 1883 and 1969, the St. John d’El Rey Mining Co. which listed in London between 1830 and 1969, and the Leopoldina Railway Co. which listed between 1899 and 1952 and inherited railway lines that converged on Rio De Janeiro.
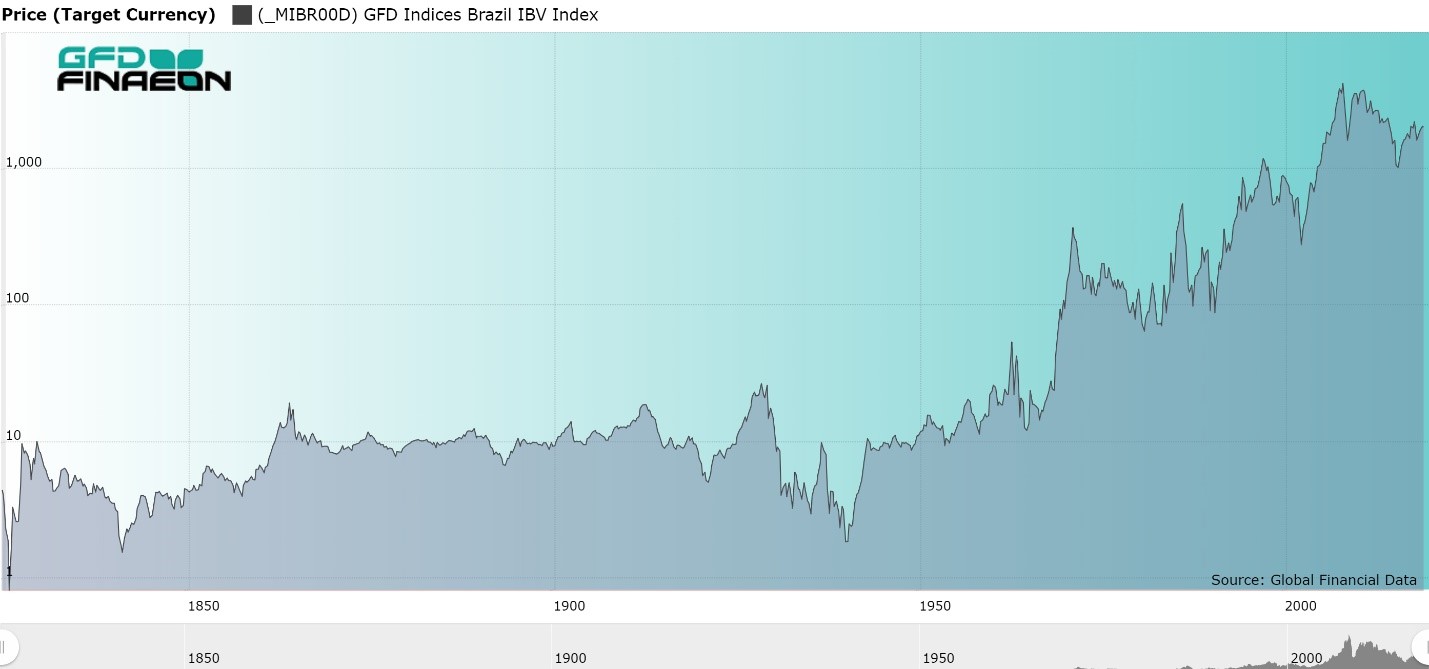
Figure 1. Brazil Stock Price Index, 1825 to 2018 in US Dollars
As Figure 1 shows, Brazilian stocks made little progress until the 1950s. There was little capital appreciation in Brazilian stocks between the 1830s and 1940s, and in some ways, this result was not unexpected. Between the 1820s and 1940s, the index relies upon Brazilian stocks that were listed in London. Brazilian stocks that listed in London provided a total return of 7.13% of which 1.50% came from capital gains and 5.6% came from dividends between 1825 and 1950. Without the dividends, investors would have received little in return from their investment in Brazil. By contrast, between 1824 and 1968, Brazilian government bonds returned 5.81% in USD while Brazilian stocks returned 7.28% providing an equity premium of 2.07%.
It is difficult to measure the long-term equity risk premium after 1968 because no risk-free instrument existed in Brazil’s hyperinflationary environment. With interest rates exceeding 3.6% per day or 790,000% per annum, you might not question whether you are going to get some money back, the only question is how much? No long-term bonds existed between 1968 and the 1990s when U.S. Dollar Brady Bonds were introduced. Real-based bonds were introduced in the 2000s. Consequently, you can calculate the equity risk premium before 1968 and after 1994, but not during the period of hyperinflation.
If you can’t even predict the inflation rate over the next month, how can you predict the inflation rate, and thus the yield on bonds, over a five- or ten-year period? Consequently, there are no benchmarks to compare the return on stocks to any other asset. The whole economy is wrapped up in avoiding inflation. Dividends lose their meaning in a world of 1000% inflation so the total return index differs little from the price index. Before 1994, the dividend yield in Brazil was usually under 1% as inflation quickly wiped out any increases in dividends. Inflation creates problems that investors in non-inflationary countries never have to think about. If you look at returns to investors in a country such as the United States which rarely has had high inflation rates, you can see how returns after inflation sink when inflation hits double digits. What would happen if inflation hit quadruple digits?
We can measure the equity risk premium between 1993 and 2018 using the MSCI Brazil Index and the EMBI U.S. Dollar Bond Index. As measured in U.S. Dollars, between 1993 and 2018, a bond investor would have received a 10.43% annual return while a stock investor would have received a 10.19% annual return. Brazilian government bonds outperformed stocks during the past 25 years. These returns are summarized in Table 1.’
| Equities | Equities | Bonds | ERP | |
| Price | Return | Return | ||
| 1825-1950 | 1.5 | 7.28 | 5.81 | 2.07 |
| 1950-1994 | 9.75 | |||
| 1994-2018 | 6.04 | 10.19 | 10.43 | -0.24 |
| 1825-2018 | 3.42 |
Table 1. Brazil Annual Equity and Bond Returns in U.S. Dollars, 1825-2018
The historical data for Brazil can either be adjusted for inflation, or converted into U.S. Dollars to eliminate the impact of Brazil’s hyperinflation, but because changes in the inflation rate and changes in the exchange rate differ from changes in the stock index, measuring bull and bear markets is difficult. When the inflation rate is 1000% and you are looking for a 20% decline in the index to register a bear market, any misalignment between the stock index and the exchange rate can produce a bear market in U.S. Dollars that didn’t occur in Brazilian Reais or Cruzeiros.
There are periods of rapid growth in Brazilian stock prices followed by a decade or more of no progress in the price of stocks in U.S. Dollars. It is interesting to note that between 1971 and 1993, the worst period of hyperinflation in Brazil’s history, despite prices rising a trillion-fold in Cruzeiros, the stock index made almost no progress in nominal US Dollars.
Even after you convert Brazilian stock prices into US Dollars, the market has gone through wild fluctuations. The stock market increased in price 20-fold between 1966 and 1971 generating an 82% annual return, but the index was at the same level 22 years later in 1993 as it had been at in 1971. The market increased 40-fold between 1990 and 2007 generating a 25% annual rate of return. However, since 2007, the Brazilian stock market has lost half of its value. At its bottom in 2016, the market was no higher than it had been in 1997. There is nothing new in this volatility. Between 1929 and 1939, the Brazilian stock market lost 90% of its value providing one of the worst returns in the world during the Great Depression.
Ride the Bull, but Get Off After That
The main conclusion you can make from all of this evidence is that Brazil is not a buy-and-hold market because it is a roller coaster with periods of tremendous gains followed by periods of a decade or more in which the stock market makes no progress. In short, Brazil is a place for market timers, and very adept market timers at that. If your timing is off, you will pay the price. In 2008 during the financial crisis, the Brazilian market declined by over 73%. In 2019, the stock market is at the same place it was at in 2006.
This is the basic problem with most emerging markets. Because of their uncertain political environment, they have an uncertain economic environment. Investors rush in when it looks like the country has changed and is ready to adopt and apply the tenants of free markets and open trade, but when things go awry, the country can linger in the doldrums for a decade or more. Nevertheless, over time the good periods of high returns in Brazil have more than offset the decade or two of low returns. While the S&P 500 returned 9.07% per annum between 1993 and 2018, Brazilian stocks returned 10.19% and bonds 10.43%. Whether that extra return is worth the extra volatility it entails is up to the individual investor. Most investors would rather avoid the risk, but if you can catch the next meteoric rise in Brazilian stocks, you will be rewarded.
