
The Dow Jones Industrial Average (DJIA) is one of the three key indices that are used to follow the United States Stock Market. Although it includes only 30 stocks and is an average of stock prices rather than a cap-weighted index of stock prices, it has been around since 1896 and along with the Dow Jones Transport Average, has more daily history than any other stock average in the world. Price data is available for the four main indices with data back to 1896, the Dow Jones Industrial Average, the Dow Jones Transport Average, the S&P Composite and the GFD-100. If we measure the annual returns for these indices from May 1896 when the DJIA began and May 2020, we find that the DJIA returned 5.59% per annum, the DJTA 4.21%, the S&P Composite 5.42% and the GFD-100 returned 6.19% Although the DJIA price index is referred to on a daily basis and includes daily data going back to 1896, the total return version of the index only began on September 30, 1987, when the DJIA was at 2596.28, Dow Jones decided to start calculating the Industrial, Transport, Utilities and Composite Averages on a total return basis using the value of the price index on September 20, 1987 as the base for the DJIA Total Return Index. While the price index closed at 25383.11 on May 29, 2020, the return index closed at 58013.46, more than double the value of the price index. Is it possible to create a total return index that precedes 1987? Of course it is. 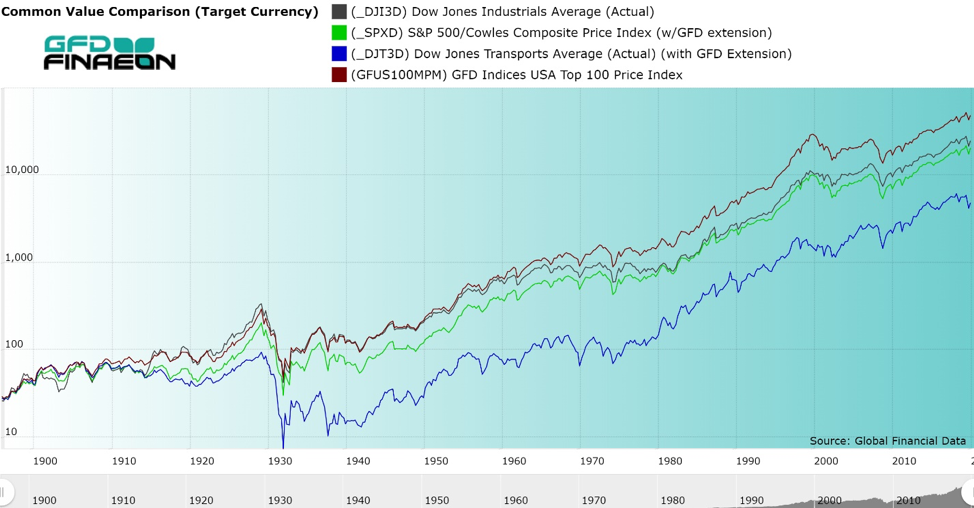 Figure 1. DJIA, DJTA, S&P Composite and GFD-100 Price Indices, 1896 to 2020 To do this, we would need two things: historical data for the DJIA price index and dividends that were paid on the stocks that were included in the DJIA. Historical data on the DJIA is readily available, as are the historic components of the DJIA. Next, we found old copies of the Dow Jones Investor’s Handbook which included data on historical quarterly dividends that had been paid on the Dow Jones Industrial Average. Unfortunately, Dow Jones only calculated quarterly dividends for the DJIA back to 1938. That meant that if we were to calculate a total return index back to 1896, we would have to collect historical data on the dividends that each stock that had been in the DJIA paid. Since Global Financial Data has collected all of this information, it was just a matter of putting the information together and making the calculations. How did the DJIA compare on a total return basis to the other three indices with data back to 1896? We will soon find out. A History of the Dow Jones Industrial Average Dow Jones has calculated several stock averages since it introduced its 14 Stock Average in 1885. The first index included 12 railroad stocks and two industrials and was calculated from February 16, 1885 until December 31, 1885. On January 2, 1886, Charles Dow introduced a new index which included 10 railroad stocks and 2 industrial stocks. On September 23, 1889, a second index was introduced which included 20 stocks and which eventually became the Dow Jones Transport Average. The Dow Jones Industrial Average was introduced on May 26, 1896 and has been calculated daily since then. Of course, in 1896, there were no computers which could calculate the Average in real time as occurs today. At the end of each day, Charles Dow simply added up the price of each of the stocks in the Average and divided the total by 12. That gave him the average value of the stocks that were included in the DJIA. It should be remembered that until October 13, 1915, stocks that were listed on the NYSE were quoted as a percentage of par, so if each stock had been at par, whether the par value for the stock was $10, $50 or $100, the average price would have equaled 100. As stocks deviated from their par value, the index would change to reflect the new prices. Dividends were also quoted as a percentage of par, so as long as prices and dividends were quoted as a percent of par, calculating the average was simple. During the 1800s, preferred stocks were often traded as much if not more than the common stocks of some companies and were often included in the DJIA. United States Steel, which had issued $500 million of common and $500 million of preferred when it issued shares in 1901 had both its common and its preferred included in the Dow Jones Industrial Average. Before World War I, most companies issued both common and preferred stocks, and if the preferred was commonly traded, it was included in the DJIA or Dow Jones Rail Average. Moreover, not all stocks paid dividends on a quarterly basis. Before World War I, many stocks only paid a dividend only twice a year. Dollars, Percents and Splits Unfortunately, things didn’t stay that way. On October 13, 1915, the NYSE changed their rules and decided to quote all stocks at their nominal dollar value, not as a percent of par. This meant that Pennsylvania Railroad, Philadelphia & Reading and Lehigh Valley stock, which had a $50 par, would be quoted at half of its former price. Utah Copper, which had a $10 par would be quoted at one-tenth of its par price. This meant that in order to calculate the Average, you had to assume that two shares of Pennsylvania Railroad stock were included in the Rail Average to maintain its weight in the Rail Average, but that could be easily done. General Motors was added to the DJIA on March 16, 1915. Its stock shot up in price and the company decided to split its stock five-to-one on December 15, 1916. How would you handle that? Dow had an easy solution, remove it from the average. General Electric had been removed from the DJIA on September 15, 1898 when it did a reverse split. On October 4, 1916, a new list of 20 industrial stocks was introduced to replace the old 12-stock Industrial Average. General Motors was kicked out of the DJIA and stayed out until August 31, 1925. To provide some history, the 20-share Average was calculated back to December 12, 1914 when the NYSE had opened up following its closure on July 31, 1914 when World War I began. Surprisingly, the DJIA did not decline while the NYSE was closed between July and December. We calculated the DJIA during the closure using bid-ask prices that were quoted for stocks by brokers on the curb. Although the DJIA did decline into October, by December, stocks had fully recovered in anticipation of the strong performance of “war babies” selling goods to the European powers trying to kill each other. After the War, Texaco split its stock, laying the foundation for numerous stock splits that would plague the DJIA in the Roaring Twenties. Of course, stocks also paid stock dividends, but these were generally ignored by the DJIA. If a stock paid a 10% dividend or even a 25% dividend, it did impact the price of the stock, driving the price down by the amount of the stock dividend, but until stock splits occurred, these were ignored by Dow. Of course, you have to understand the difference between a stock split and a stock dividend. A stock dividend provided you more of the same stock. So if a company had 1,000,000 shares of $100 par stock outstanding and issued a 20% stock dividend, you would have 120 shares of $100 par stock rather than 100 shares. The price of the stock would decline by 20%, but no more. What this does is to create a downward bias in the DJIA. If a company increases the number of shares by 20%, the stock price will decline by 20% reducing the value of the average, but since there is no adjustment in the stock index, the stock index will appear to have fallen. The same would be true of a rights distribution or a stock distribution that reduced the price of the stock. General Electric provided rights distributions in 1905, 1906, 1918 and 1920, a 30% stock dividend in 1913 (and the DJIA fell 4%), and stock distributions each year between 1922 and 1926 and in 1932. All of these actions reduced the price of General Electric stock without being taken into consideration in the value of the DJIA. On the other hand, if there were a stock split, you would receive new shares to replace the old. In the case of Texaco (then known as the Texas Co.), the first DJIA stock to split, shareholders received 4 new $25 par shares in exchange for 1 old $100 par share. So how do you deal with that? Simply take the new price of the stock, multiply by 4 and assume the Average included four shares of Texaco instead of one. But Texaco wasn’t the only stock to split. It was followed by American Car & Foundry, General Electric, Studebaker, American Locomotive, American Can, American Tobacco and Sears. Each time a stock split, you had to multiply the number of shares in the DJIA by the size of the split, so by 1928 the DJIA included 4 Texaco shares, 2 American Car & Foundry, 4 General Electric, 2.5 Studebaker, 2 American Locomotive, 6 American Can, 2 American Tobacco and 4 Sears. Obviously, calculating the DJIA was getting very complicated. Dow came up with a solution to this problem in 1928. It introduced the concept of a divisor. On October 1, 1928, the number of stocks in the DJIA was increased from 20 to 30 and a divisor was introduced to calculate the average. Now you added up the price of all the stocks and instead of dividing by the number of stocks in the Average, you divided by the divisor. If a new stock were added or a stock split, you simply changed the value of the divisor. The divisor was set at 16.67 on October 1, 1928 to reflect the impact of the stock splits that had occurred before then. Since then, the divisor has steadily declined, and today the divisor for the DJIA stand at about 0.1458. So if you want to calculate the value of the DJIA on your own, sum up the price of the 30 members, divide the sum by 0.1458 and you will get the value of the Dow Jones Industrial Average. Although very few of the stocks that are included in the Averages today provide small stock dividends to its shareholders, historically, some of the stocks did provide stock distributions and rights distributions that were not included in the divisor. For example, on December 15, 1932, GE distributed 1/6 share of Radio Corp. of America to shareholders, but this did not affect the DJIA divisor. So as you can see, what first looks like a very simple process of adding up the values of the stocks and the dividends and adjusting the prices of the stocks for those dividends is in reality a very complicated action. Nevertheless, it is doable. Collecting the Data We were able to collect quarterly dividend data from the Dow Jones Handbooks back to 1938. This meant that we would have to collect dividend data on the stocks that were included in the Dow Jones Industrial Average before 1938. Our goal was to create a quarterly “dividend” that would be paid out to the Dow Jones Industrial Average just as if it were a stock. We collected data for each of the components of each index going back to 1885, the 14-stock Average in 1885, the 12-stock Average between 1886 and 1896, the 12 Industrial stocks between 1896 and September 1916, the 20-stock Average between August 1914 and September 1928 and the 30-stock Average beginning in October 1928. We adjusted the value of the dividends when the par was different from $100 or when there was a split. So after Texaco stock split in 1920, we simply multiplied all subsequent dividends by four as if you were holding 4 shares of $25 par stock instead of 1 share of $100 par stock. We were able to obtain information on the DJIA divisor beginning in October 1928 and used this value to divide the sum of the dividends by the DJIA divisor so we could get an accurate calculation of the dividend that would have been paid to shareholders each quarter.
 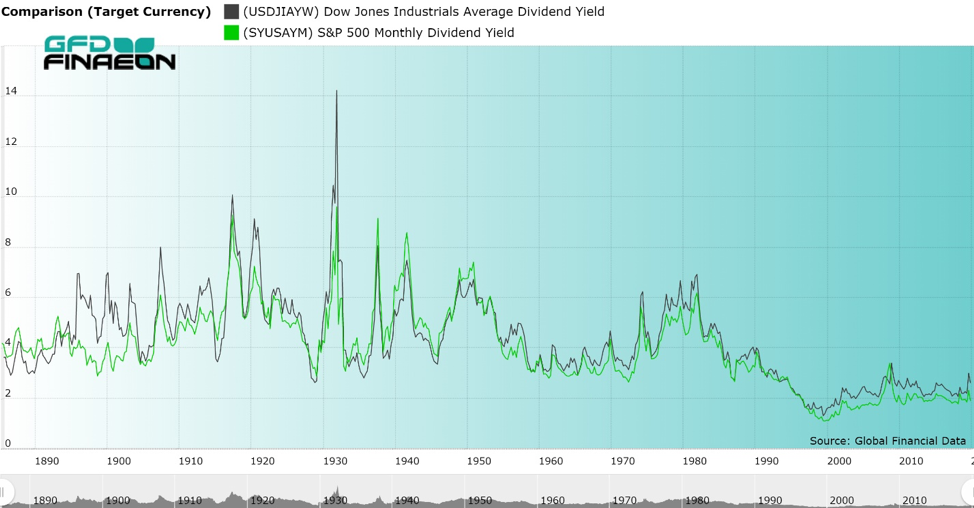 Figure 2. Dow Jones Industrial Average & S&P Composite Dividend Yield, 1886 to 2020 The yield on the DJIA and the S&P Composite from 1886 until 2020 is illustrated in Figure 2. From 1890 until 1990, the yield averaged between 4 and 5 percent. During periodic market crashes, the yield would rise, increasing to 14% in June 1932 at the height of the Great Depression. The 1980s and 1990s saw a collapse in the yield as it declined from 6.99% in 1980 to 1.3% in 2000. Since then, it has moved back up, hitting 3% in April 2020. All of this data is available to subscribers to the Global Financial Database. The quarterly dividends can be found in the file USDJIADQ and the annual sum of the quarterly dividends in USDJIADM. The dividend yield for the DJIA is available in USDJIAYW and the Total Return for the DJIA is available in _DJITRD. We have calculated the index back to 1886 when the 12-stock index that included both railroad and industrials began. We have used the 12-stock average up to July 1914 and the 20-stock Average beginning in August 1914. The 30-stock Average begins on October 1, 1928. Results So what did we find out from all of this work? We found that the Dow Jones Industrial Average outperformed the S&P 500 and the Dow Jones Transports but underperformed the GFD-100 Index. This is illustrated in Figure 3. On average, including dividends, the Dow Jones Industrial Average returned 10.26% per annum between May 1896 and May 2020. You can contrast this with returns of 8.40% to the Dow Jones Rail/Transport Average, 9.70% to the S&P Composite and 10.36% to the GFD-100 Index which includes the top 100 stocks in the United States each year regardless of its sector. The DJIA clearly beat the S&P Composite on a total return basis. The differences between the two indices is not significant, but it is interesting that over a 124-year period, the differences in the return between the 30 stocks in the DJIA and the 500 stocks in the S&P Composite would be so small, especially given the fact that one is an average of stock prices and the other is a cap-weighted index of stocks. On the other hand, if you compare the DJIA and the Dow Jones Rails/Transports Average since 1889, as illustrated in Figure 4, you can see that the differences in the returns are significantly different. While the DJIA returned 10.26% per annum, the DJTA returned only 8.43% per annum. Obviously, the sector you choose makes a difference.
 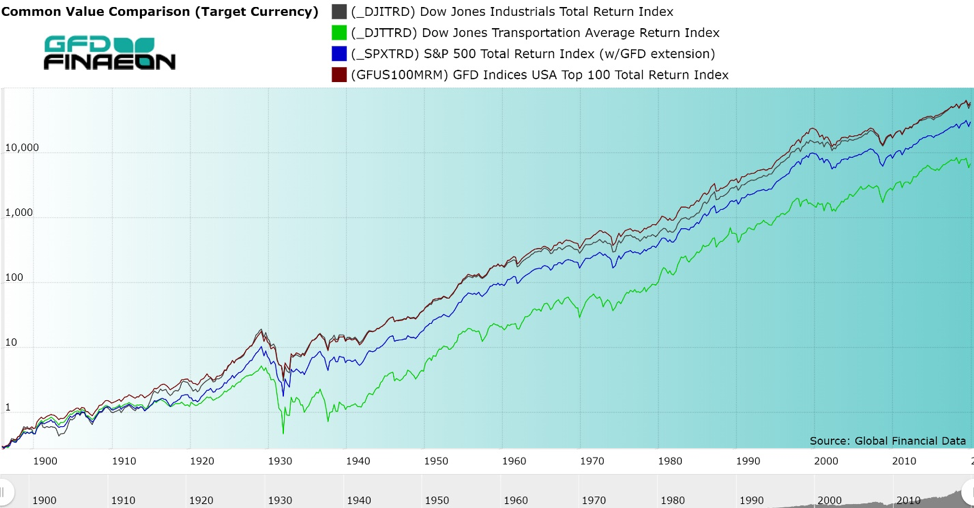 Figure 3. DJIA, DJTA, S&P Composite and GFD-100 Total Return Indices, 1896 to 2020 One of the most interesting discoveries of this research is how dividends have changed over the past 130 years. This is illustrated in Figure 4. Up until World War II, dividends were extremely volatile, collapsing during the downturns that occurred in 1895, 1903, 1915 and the 1930s. However, since 1945, dividends have followed a steady path upward, consistently rising almost every year. The steady increase in dividends to companies in the DJIA has sustained the steady returns that investors have enjoyed.
 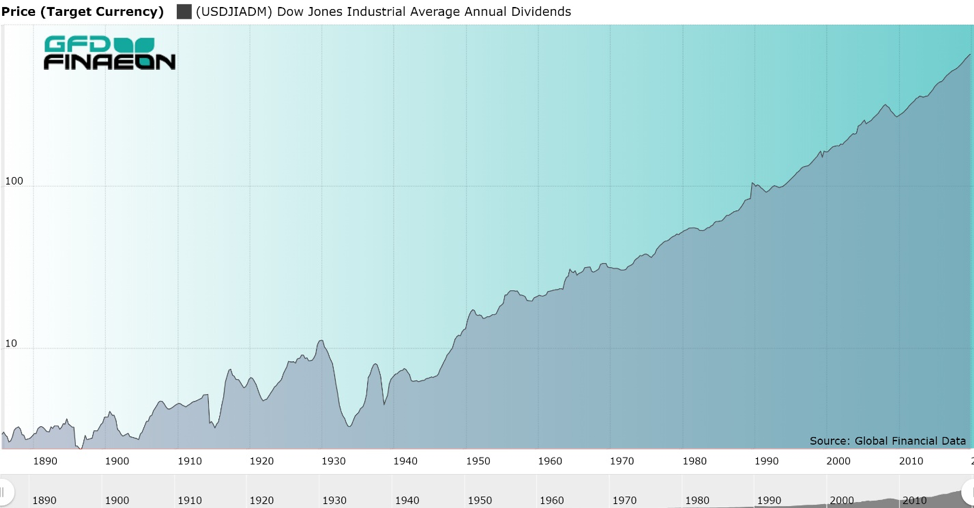 Figure 4. Dow Jones Industrial Average Annual Dividend, 1886 to 2020 Conclusion Until now, no one has calculated the Dow Jones Industrial Average on a total return basis back to 1896. Although data for the price index has been around for 125 years, data on the total returns have only existed since 1987 when Dow Jones first started calculating a daily total return index for the Dow Jones Industrials, Transports, Utilities and Composite Averages. Although the Averages began as relatively simple indices to calculate, simply adding up the prices of the components and then dividing by the number of stocks that were included in the Averages, the impact of changes in the components, stocks splits, different pars, stock distributions and other corporate actions has made a relatively simple task quite complex. Today, the impact of all of these actions are included in the divisor which changes whenever there is a stock split or a change in the components of the Average. If you compare the returns to the DJIA, the S&P Composite and the GFD-100, they are remarkably similar, even though you are looking at returns over a period of almost 125 years. On the other hand, if you compare the returns to the Dow Jones Rails/Transports Average with the Dow Jones Industrials Average, the returns are significantly different. The lesson to be learned here is that sector is more important than size. US stocks have provided solid returns over the past 125 years and there is no reason to believe that this won’t continue to be true.

Not only did the Covid Crisis send stocks tumbling in March throughout the world, but it also created some of the worst monthly performances for the month of March in stock market history. It is very unusual for so many countries to register their worst performance across the globe, but this occurred in March. Global Financial Data has collected monthly performance data for 21 countries and 3 regions covering over 100 years of history. In the majority of the countries that we cover, March 2020 was the worst performing March since 1900. It was also the worst performing March for the World Index and the World x/USA Index. Information on the worst March for each country is provided in Table 1. For many of the countries, GFD has data back to 1900, or even before. March 2020 provided the worst performance for March in history in 12 of the 21 countries. These countries included Australia, Austria, Belgium, Finland, France, India, Ireland, Italy, Netherlands, New Zealand, Norway and Spain. The worst decline was in Austria where stocks fell 24% during March. This was the first time any of the countries had had their worst month since 2012. All of the other worst March declines were scattered throughout history ranging from 1924 in Germany to 1980 in Canada. February 2020 was the worst performing February in Belgium, Norway and in Europe as a whole. On the other hand, April 2020 was the best performing April in Canadian history. 2020 has already proven to be a highly volatile year and given the uncertainty over how the Coronavirus will impact financial markets during the rest of the year, we cannot guarantee that more monthly records won’t be set.
| Country | Index | Since | Year | Decline |
| Australia | Australia ASX All-Ordinaries | 1840 | 2020 | -21.51 |
| Austria | Wiener Boersekammer Share Index (WBKI) | 1922 | 2020 | -24.03 |
| Belgium | Brussels All-Share Price Index | 1926 | 2020 | -16.94 |
| Canada | Canada S&P/TSX 300 Composite | 1900 | 1980 | -18.02 |
| Denmark | OMX Copenhagen All-Share Price Index | 1900 | 2001 | -7.25 |
| Finland | OMX Helsinki All-Share Price Index | 1913 | 2020 | -16.81 |
| France | France CAC All-Tradable Index | 1900 | 2020 | -18.33 |
| Germany | Germany CDAX Composite Index | 1900 | 1924 | -24.03 |
| India | Bombay SE Sensitive Index | 1693 | 2020 | -23.05 |
| Ireland | Ireland ISEQ All-Share Price Index | 1830 | 2020 | -19.44 |
| Italy | FTSE Italia All-Share Index | 1905 | 2020 | -22.33 |
| Japan | Tokyo SE Price Index (TOPIX) | 1914 | 1953 | -19.12 |
| Netherlands | Netherlands All-Share Price Index | 1914 | 2020 | -12.19 |
| New Zealand | New Zealand SE All-Share Capital Index | 1862 | 2020 | -13.60 |
| Norway | Oslo SE OBX-25 Stock Index | 1914 | 2020 | -13.24 |
| South Africa | FTSE/JSE All-Share Index | 1900 | 1982 | -14.08 |
| Spain | Madrid SE General Index | 1918 | 2020 | -22.82 |
| Sweden | OMX Stockholm All-Share Price Index | 1901 | 1932 | -27.64 |
| Switzerland | Switzerland Price Index | 1921 | 1965 | -8.80 |
| United Kingdom | GFD Indices UK Top 100 Price Index | 1900 | 1974 | -17.80 |
| United States | GFD Indices USA Top 100 Price Index | 1900 | 1938 | -21.93 |
| World | GFD Indices Developed World Price Index (USD) | 1900 | 2020 | -13.47 |
| World x/USA | GFD Indices Developed World x/USA Price Index (USD) | 1900 | 2020 | -12.60 |
| Europe | GFD Indices Developed World Europe Price Index (USD) | 1900 | 1980 | -13.85 |
Table 1. Worst March Performances by Country, 1900 to 2020

So far the coronavirus has given investors a wild ride during the first half of the year. Virtually every stock market in the world declined in value during the first quarter of 2020 and virtually every stock market bounced back during the second quarter. Although only the NASDAQ bounced back to new highs, and both Denmark and the United States are up for 2020, most stock markets declined during the first half of 2020. Nevertheless, most stock markets throughout the world recovered the majority of their losses during the first quarter of the year during the second quarter. Table 1 provides data on percentage returns for the month of June, the first quarter of 2020 and the second quarter of 2020 for 21 countries and 3 regions. As Table 1 shows, every stock market was down during the first quarter and up during the second quarter.
| Country | Jun-20 | Q1 2020 | Q2 2020 |
| Australia | 2.20 | -24.87 | 17.43 |
| Austria | -0.59 | -33.27 | 10.53 |
| Belgium | 2.94 | -29.59 | 9.76 |
| Canada | 2.12 | -21.59 | 15.97 |
| Denmark | 0.37 | -9.73 | 16.14 |
| Finland | -0.46 | -20.40 | 17.20 |
| France | 4.65 | -26.82 | 12.85 |
| Germany | 4.54 | -25.35 | 22.15 |
| India | 7.68 | -28.57 | 18.49 |
| Ireland | 1.45 | -28.26 | 15.92 |
| Italy | 5.99 | -27.54 | 13.84 |
| Japan | -0.31 | -13.08 | 11.10 |
| Netherlands | 5.34 | -21.15 | 17.42 |
| New Zealand | 4.89 | -15.76 | 16.31 |
| Norway | -0.35 | -23.43 | 8.60 |
| South Africa | 7.68 | -22.06 | 22.19 |
| Spain | 2.16 | -29.39 | 6.42 |
| Sweden | 2.16 | -18.39 | 16.38 |
| Switzerland | 1.54 | -9.84 | 8.09 |
| United Kingdom | 1.53 | -24.80 | 8.77 |
| United States | 2.71 | -17.66 | 20.19 |
| World | 2.51 | -20.10 | 15.93 |
| World x/USA | 3.22 | -23.00 | 10.61 |
| Europe | 3.88 | -25.39 | 10.06 |
Table 1. Monthly and Quarterly Returns in 2020 It should be remembered that the month of July and the third quarter of the year are often the weakest quarters of the year. July is not the best performing month in any country in the world, and the second quarter is the worst performing quarter in seven of the twenty-one countries we cover. On average, the world index rises by 0.76% in the third quarter, but the world x/USA index rises only 0.01%. Since the world has gone through a rapid recovery during the second quarter of 2020, some markets are likely to fall back during the third quarter of 2020. We can only warn investors to be cautious for the third quarter of 2020. The monthly scorecard for June and tables covering returns in 21 countries and 3 regions are provided below. As always, best months are marked in green and worst months in red. June Monthly Scorecard Smallest Monthly Increase – Belgium, Canada, France, South Africa Fewest Monthly Increases – Austria, Belgium, Canada, Netherlands, Spain Best Month – Finland (1945), Ireland (1847), United Kingdom (1720), Europe (1864) Worst Month – Germany (1948) Largest Quarterly Increase – India Fewest Quarterly Increases – Finland, Norway, Sweden Largest Monthly Increase Since 1900 – Belgium Smallest Monthly Increase Since 1900 – France, South Africa Fewest Monthly Increases Since 1900 – Austria, Belgium, Canada, Denmark, France, South Africa, Spain, United Kingdom, World, World x/USA, Europe Best Month Since 1900 – Finland (1945) Worst Month Since 1900 – Germany (1948) Most Quarterly Increases Since 1900 – New Zealand Fewest Quarterly Increases Since 1900 – Finland, Norway, Sweden

25 years ago: August 1995 S&P 500: 561.88 (vs. 3351.28 in 08/2020) 10-year U.S. Government Bond Yield: 6.28% (vs. 0.57% in 08/2020) Gold: $382.35 (vs. $2067.15 in 08/2020) Oil: $17.895 (vs. $41.93 in 08/2020) GBP/USD: 1.5495 (vs. 1.305 in 08/2020) US GDP: $7,581 billion (vs. $19,409 billion in 06/2020) US Population: 266 million (vs. 331 million in 2020) 08/01/1995: Westinghouse agrees to buy CBS for $5.4 billion. The interbank loan market stopped working due to concerns about connected lending in many new banks. 08/02/1995: Saudi Arabia's King Fahd issues a decree replacing all members of the Council of Ministers who do not have blood ties so the royal Family. While most of the Council's top positions are unaffected by the reshuffling, Oil Minister Hisham Nazer is replaced with Ali bin Ibrahim al-Naimi. (WSJ) 08/03/1995: Union Pacific will acquire Southern Pacific in a $3.9 billion pact -- creating the largest U.S. railroad. 08/05/1995: The city of Knin, Croatia, a significant Serb stronghold, is captured by Croatian forces during Operation Storm. The date is celebrated in Croatia as Victory Day. 08/10/1995: Oklahoma City bombing: Timothy McVeigh and Terry Nichols are indicted for the bombing. Michael Fortier pleads guilty in a plea-bargain for his testimony. 08/24/1995: Microsoft's launch of Windows 95 is met with eager demand, possibly hitting $700 million in sales the first day. 08/27/1995: Chemical Banking and Chase Manhattan plan a $10 billion merger, unseating Citicorp as the largest U.S. bank. 08/31/1995: Time Warner reaches a tentative pact to acquire Turner for $8 billion -- creating the world's largest media company. The Bank of Japan cuts its discount rate to half a percentage point from 1%. Orange County officials hammer out a 15-year financial-recovery plan. 50 years ago: August 1970 S&P 500: 81.52 (vs. 3351.28 in 08/2020) 10-year U.S. Government Bond Yield: 7.49% (vs. 0.57% in 08/2020) Gold: $35.80 (vs. $2067.15 in 08/2020) Oil: $3.21 (vs. $41.93 in 08/2020) GBP/USD: 2.3836 (vs. 1.305 in 08/2020) US GDP: $1,067 billion (vs. $19,409 billion in 06/2020) US Population: 209 million (vs. 331 million in 2020) 08/07/1970: Ninety-day Mid-East cease-fire arranged. 08/15/1970: Patricia Palinkas becomes the first woman to play professionally in an American football game. 08/17/1970: Venera 7 launched. It will later become the first spacecraft to successfully transmit data from the surface of another planet (Venus). 08/18/1970: Biggest trading day in 122-year history of Chicago Board of Trade. Record 309 million bushels of grain changed hands, 13% above previous record on June 16, 1966. 08/23/1970: Organized by Mexican American labor union leader Cesar Chavez, the Salad Bowl strike, the largest farm worker strike in U.S. history, begins. 08/29/1970: Chicano Moratorium against the Vietnam War, East Los Angeles, California. Police riot kills three people, including journalist Rubin Salazar. 100 years ago: August 1920 S&P 500: 7.7294 (vs. 3351.28 in 08/2020) 10-year U.S. Government Bond Yield: 5.67% (vs. 0.57% in 08/2020) Gold: $20.67 (vs. $2067.15 in 08/2020) Oil: $6.10 (vs. $41.93 in 08/2020) GBP/USD: 3.555 (vs. 1.305 in 08/2020) US GDP: $84 billion (vs. $19,409 billion in 06/2020) US Population: 106.46 million (vs. 329 million in 2020) 08/09/1920: Mr. Chamberlain announces decision to end bread subsidy before the end of the financial year. Bolshevist peace terms announced in Commons. 08/10/1920: Ottoman sultan Mehmed VI's representatives sign the Treaty of Svres that divides up the Ottoman Empire between the Allies. Greece acquires Eastern Thrace and is assingned administration of the area of Smyrna for 5 years. 08/11/1920: The Latvian-Soviet Peace Treaty, which relinquished Russia's authority and pretenses to Latvia, is signed, ending the Latvian War of Independence. 08/13/1920: Polish-Soviet War: the Battle of Warsaw begins and will last till August 25. The Red Army is defeated. 08/14/1920: A security agreement is signed between Czechoslovakia and the Kingdom of Serbs, Croats and Slovenes. 08/16/1920: Ray Chapman of the Cleveland Indians is hit on the head by a fast ball thrown by Carl Mays of the New York Yankees, and dies early the next day. Chapman was the second player to die from injuries sustained in a Major League Baseball game, the first being Doc Powers in 1909. 08/18/1920: The Nineteenth Amendment to the United States Constitution is ratified, guaranteeing women's suffrage. 08/25/1920: Polish-Soviet War: Battle of Warsaw, which began on August 13, ends with theRed Army's defeat. 08/30/1920: Battle of Giby: Lithuanian withdrawal successfully mediated by French at request of Poland during Polish-Lithuanian War 08/31/1920: The first radio news program is broadcast by 8MKin Detroit, Michigan. The total defeat of the Russian Fourth, Fifteenth and Sixteenth Armies marked the end of the battle. 200 years ago: August 1820 S&P 500/GFD US-100: 1.633 (vs. 3351.28 in 08/2020) 10-year U.S. Government Bond Yield: 4.513% (vs. 0.57% in 08/2020) Gold: $19.39 (vs. $2067.15 in 08/2020) GBP/USD: 4.5126 (vs. 1.305 in 08/2020) US GDP: $727 million (vs. $19,409 billion in 06/2020) US Population: 9.6 million (vs. 331 million in 2020) 08/24/1820: Liberal Revolution of 1820 against the British-led Regency of William Carr Beresford begins in Porto on 24 August. The Regency's troops decline to act against their countrymen and on 15 September declare for King, Cortes and Constitution. A provisional government is established on 1 October to oversee elections to the Cortes. © 2020 Global Financial Data. Please feel free to redistribute this Events-in-Time Chronology and credit Global Financial Data as the source.
