 In a previous blog, I documented the worst hyperinflation in history, which was suffered by Hungary in 1946. When Hungary finally converted from the Pengo to the Forint, it took 400,000 Quadrillion Pengö to get one Forint! Yugoslavia failed to beat Hungary’s record, but if Yugoslavia failed to win the gold in the Inflation Olympics, it wasn’t for lack of trying. You can probably blame one person, Slobodan Milošević for the collapse not only of the country’s currency and economy, but for the country itself.
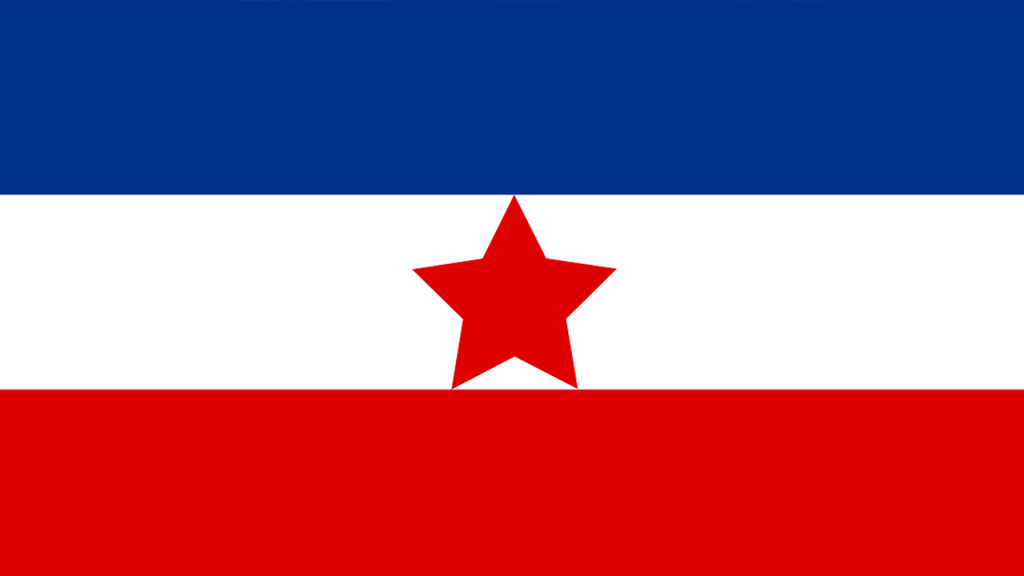
A Socialist Country that Relied on the Market
Yugoslavia was an amalgam of different countries when it was formed after World War I, and its original name, the Kingdom of the Serbs, Croats and Slovenes indicated its origins. After World War II, Yugoslavia’s dictator, Josip Broz Tito, distanced himself from the Soviet Union in 1948 and sought his own path for Yugoslavia. The country played a unique role during the cold war. Yugoslavia was a socialist country that relied upon the market to allocate goods. Some economists looked upon Yugoslavia positively as a country that had found the middle ground between the socialism of the Soviet bloc and the capitalism of the West. Unfortunately, this middle ground worked better in theory than in practice.
War, Sanctions and Hyperinflation
Slobodan Milošević became the President of Serbia on May 8, 1989. Though his goal was to restore Serbian supremacy in Yugoslavia, he was instrumental in destroying Yugoslavia. The collapse of the country may have been inevitable, but the collapse of the economy and currency were not. In January 1991, Slobodan Milošević ordered the Serbian National Bank to issue $1.4 billion in credit to his friends. After Milošević resigned from power, he would be charged with corruption and embezzlement because of this and other actions. In 1992, the United Nations imposed sanctions on what was left of Yugoslavia as a result of the carnage that was occurring in Bosnia and Herzegovina. Consequently, both GDP and fiscal revenue declined while the cost to Milošević of fighting his wars with Yugoslavia’s former republics rose. Milošević had already raided the Serbian National Bank and by this time, most of the country’s hard currency was gone. The sanctions hit Yugoslavia hard, and its financial resources dried up. Milošević saw only one solution to survive: print money. Inflation was nothing new to Yugoslavia. Yugoslavia had suffered double-digit inflation in every year save one between 1969 and 1986. Inflation rose to even higher levels after 1985, moving from 87% in 1985 to 162% in 1987 and to 2719% in 1989. When the United Nations imposed sanctions on Yugoslavia in 1992, the country quickly collapsed into hyperinflation. Prices increased 17,200% in 1992, and an incredible 3 quadrillion percent in 1993. Inflation was 1788% in December 1993 and 4139% in January 1994, though one wonders how the government arrived at such exact figures. The hyperinflation finally ended in March 1994, and by 1995, the annual inflation rate was a more “normal” 122%.
The Government Tries to Regulate Inflation but Causes the Economy to Collapse
The government tried to contain the inflation through bureaucratic measures, such as imposing price controls, though this only exacerbated the situation because bakers and slaughter houses stopped producing food rather than produce at a loss. Yugoslavia’s gas stations were closed and gasoline could only be bought from black market entrepreneurs on the sides of the roads. When the government required firms to file paperwork every time they raised prices, this measure hastened inflation because firms would raise their prices by more than was needed in order to reduce the amount of paperwork they had to file.

In November 1993, the government delayed turning on the heat in government-owned apartment buildings in order to save money, so the buildings’ tenants bought inefficient space heaters which overloaded the electrical system leading to blackouts. Pensioners and other Yugoslavs delayed making payments for government services, knowing that even a few days’ delay would wipe out the cost of making any payments. In short, the economy collapsed. As the inflation got worse, businesses began using Deutsche Marks instead of Yugoslav Dinars to avoid losing money from the continual erosion in the value of the Dinar. To keep up with the inflation, Yugoslavia had to continually issue new currencies to get rid of the zeroes that were piling up. On January 1, 1990, a new Dinar replaced the old Dinar at the rate of 10,000 to 1, in July 1992 another Dinar was introduced at the rate of 10 to 1, and in October 1993 another new Dinar was introduced at the rate of 1 million old Dinar to 1 new Dinar. In January 1994 the 1994 Dinar was introduced at the rate of 1 billion 1993 Dinar to 1 1994 Dinar, which was replaced in turn by the Super Dinar at the rate of 12,500,000 to 1 in less than a month. In one year, between December 1992 and December 1993, the effective exchange rate between the Yugoslav Dinar and the US Dollar had gone from 900 Dinars to the US Dollar to 3 billion million million Dinars (3 sextillion for anyone who cares) to the US Dollar. In February 1994, 1 new Super Dinar was equivalent to 1.2 Octillion (1.2 billion billion billion, i.e. 27 zeroes) Dinars from 1989.
Milošević Is Kicked Out of the Country He Destroyed

Despite destroying the economy, Slobodan Milošević battled on and remained in power for another six years. He resigned from office following the disputed elections of September 24, 2000, and he was arrested on March 31, 2001 on suspicion of corruption, abuse of power and embezzlement. The Serbian authorities were unable to prove their case, and Milošević was extradited to the International Criminal Tribunal for the Former Yugoslavia in The Hague where he remained until he died in his prison cell on March 11, 2006. Did Milošević receive a just punishment? Notes issued by colonial Georgia warned that “To counterfeit is death without benefit of clergy.” During the French Revolution when “la loi punit de mort le contrafacteur”, more people were put to death for counterfeiting than for any other offense. In England two hundred years ago, counterfeiting was punishable by hanging, not only for counterfeiting currency, but even for passing a counterfeit bill to another person, a law which put a number of innocent people to death.
In his own way, Slobodan Milošević was probably one of the greatest counterfeiters of all time, and though Slobodan Milošević may not have suffered the death penalty for his destruction of Yugoslavia’s currency and economy, at least he spent the rest of his life in prison for his crimes.
Ivar Kreuger was a financial genius, for better or for worse.
Kreuger was an industrial and financial genius who sought complete control over the operations of his global match conglomerate. At the height of his power, Kreuger ran a monopoly that controlled 75% of all global match sales. Kreuger succeeded, in part, by introducing innovations in finance that are still being used today, but which have also been used by companies such as Enron and others to deceive investors. His insatiable desire for complete control and the promises Kreuger made that couldn’t be kept led to the collapse of his company in 1932 and billions of dollars in losses to investors.
Miracle Man
Ivar Kreuger got his start in the construction business, introducing new engineering techniques in Sweden that enabled him to win contracts to build the Stockholm Olympic Stadium (1912) and Stockholm City Hall (1913). He succeeded not only because he used the latest construction technology, but because Kreuger was able to complete these buildings on time and on budget. Unlike other construction companies, Kreuger promised to pay a penalty if buildings were not completed by the contract date. He also asked that he receive a bonus if the projects were completed early, which they often were. Kreuger was a wheeler and dealer from the beginning. He knew how to incentivize his clients to both win contracts and to profit from them.
Financial Innovations of the Leonardo of Larcenists
Kreuger, or the Leonardo of Larcenists as John Kenneth Galbraith referred to him, was able to achieve his rapid expansion because of his financial innovations and financial engineering. This enabled him to control how profits were reported, registering profits when none existed and shifting profits from one company or division to another to show a steady increase in profits. Kreuger wanted complete control. He created “A” and “B” shares for Kreuger and Toll, which enabled him to raise capital while not giving up power over his company. The “B” shares had the same rights to profits and dividends, but not the same votes. “B” shares had 1/1000of a voting right compared to an “A” share. Issuing different classes of shares to maintain control is commonplace today. In 2014, Google issued new shares that had only 1/10 of a vote of the original shares. Kreuger was able to attract additional capital to Kreuger and Toll by consistently paying a high dividend of 15% to 20%. When Kreuger and Toll issued American Depository Receipts (another innovation) for their shares in New York, they were able to raise tens of millions of dollars. Kreuger and Toll also issued convertible gold debentures paying 6.5%, a high rate at the time, which could be converted into common stock if the price of Kreuger and Toll stock rose. When Kreuger loaned money to governments he used binary foreign exchange options to protect his company from exchange rate fluctuations. These enabled Kreuger and Toll to specify in which currency, Dutch Guilders or United States Dollars, governments would pay back their loans. Kreuger always demanded payment in the stronger currency. Kreuger’s real innovation, however, was in using off-balance sheet entities to expand the company’s operations. Kreuger shifted losses into companies that were not included in the firm’s consolidated balance sheet so the company would always appear to enjoy growing profits. Kreuger differentiated between companies he had a majority interest in and ones he had a minority interest in. Profitable companies with a majority interest were placed on the balance sheet; companies with a minority interest were treated as investments. This enabled Kreuger to hide many of his loss-making investments from investors and competitors. The technique gave the company leverage which meant soaring profits in a bull market. But as Enron, Bear Stearns and Lehman Brothers were to discover decades later, this technique could also lead to large losses or even the collapse of the company when the market declined. Kreuger and Toll was not a Ponzi scheme. Profits were reinvested in Kreuger and Toll’s divisions and subsidiaries to maintain the growth and success of the company. However, because Kreuger and Toll was highly leveraged, Kreuger needed to constantly expand his operations to pay the high dividends his companies provided, to issue new loans to governments, to purchase new companies, to obtain new monopolies, to expand his conglomerate, and to show expanding profits to shareholders and stakeholders. Like a hamster on a wheel, Kreuger had to run faster and faster to maintain the appearance of success.House of Cards
The Great Depression contributed to the collapse of Kreuger’s house of cards. When revenues and profits declined, Kreuger needed loans to keep his company going. Rumors began to spread that Kreuger and Toll was facing financial difficulties and the price of the company’s stock began to decline. As the graph below shows, the price of Kreuger and Toll “B” shares plummeted from 46 in March 1928 to 6 in September 1931 and traded around that level until March 1932 when the complete collapse of the company made the shares virtually worthless.
Kreuger had $650 million in capital on his balance sheet in 1932, which he used as collateral for loans and operations. Unbeknownst to anyone else, over $100 million of this was in Italian bonds which Kreuger had personally forged. Of his $400 million in “other investments”, $250 million turned out to be nothing but creative accounting.
As rumors swelled and investors and governments began to demand answers, Kreuger scheduled a meeting with Ivar Rooth, chairman of the Swedish Riksbank, to negotiate a loan to save Kreuger and Toll. The two of them were to meet in Berlin on March 13, 1932, but on March 12, Kreuger was found dead in his room from an apparently self-inflicted gunshot wound to the head.
The National Bureau of Economic Research was founded in 1920 as a private, nonprofit, nonpartisan research organization dedicated to promoting a greater understanding of how the economy works.
 This week marks the hundredth anniversary of the beginning of World War I. On June 28, 1914, Austrian Archduke Franz Ferdinand was assassinated in Sarajevo. This event led to a month of failed diplomatic maneuvering between Austria-Hungary, Germany, France, Russia, and Britain which ended with the onset of the Great War, as it was originally called.
Austria-Hungary declared war on Serbia on July 28, causing Germany and Russia to mobilize their armies on July 30. When Russia offered to negotiate rather than demobilize their army, Germany declared war on Russia on August 1. Germany declared war on France on August 3, and when Germany attacked Belgium on August 4, England declared war on Germany. Europe was at war, and millions would die in the battles that followed.
This week marks the hundredth anniversary of the beginning of World War I. On June 28, 1914, Austrian Archduke Franz Ferdinand was assassinated in Sarajevo. This event led to a month of failed diplomatic maneuvering between Austria-Hungary, Germany, France, Russia, and Britain which ended with the onset of the Great War, as it was originally called.
Austria-Hungary declared war on Serbia on July 28, causing Germany and Russia to mobilize their armies on July 30. When Russia offered to negotiate rather than demobilize their army, Germany declared war on Russia on August 1. Germany declared war on France on August 3, and when Germany attacked Belgium on August 4, England declared war on Germany. Europe was at war, and millions would die in the battles that followed.
Open Financial Markets Led to Closed Exchanges
Ironically, it was because of the openness of global financial markets before the war that the global closure of stock markets occurred. At the beginning of 1914, capital was free to flow from one country to another without hindrance. All the major countries of the world were on the Gold Standard, and differences in exchange rates were arbitraged through the buying and selling of international bonds listed on the world’s stock exchanges. A country such as Russia would issue a bond that was listed on the stock exchanges in London, New York, Paris, Berlin, Amsterdam and St. Petersburg. Differences in exchange rates between countries could be arbitraged by buying and selling bonds in different markets. In effect, this made European stock exchanges a single, integrated market. In 1914, currency flowed between countries with lightning speed. During the Napoleonic wars, money could only move as quickly as a ship could venture from one country to another. By 1914, cables stretched across the oceans of the world, and money as well as stock orders could be wired telegraphically from one corner of the world to another in minutes. Traders throughout the world could sell bonds and shares instantly, and it was the fear of massive selling, and the impact this would have on global markets that led to the shutdown of European exchanges. There was a concern that investors would try to repatriate their money leading to massive selling, a sharp fall in prices, and large amounts of capital flowing out of one country and into another. The impact of selling on brokers and jobbers was exacerbated by the way shares were traded on the London Stock Exchange. Individual trades were made on a daily basis, then carried until Settlement Day when trades were matched and crossed. Brokers would make up the surplus or deficit on their accounts by settling outstanding trades with cash. As long as there were no significant swings in stock or bond prices, brokers had sufficient capital to settle their accounts. However, since traders relied on credit, large swings in prices could and would bankrupt many of the brokers, worsening the financial panic. To avoid this problem, stock markets were closed until a solution could be found.The War Drives Stock Prices Down
Of course, to investors not being able to buy or sell shares is even worse than selling them at a loss. Although stocks could not be traded on the main exchanges, over-the-counter markets replaced exchanges for those who were desperate enough to sell. Although the NYSE was closed between July 30 and December 12 of 1914, stocks were quoted by brokers and traded off the exchange. Global Financial Data has gone back and collected stock prices during the closure of the NYSE to recreate the Dow Jones Industrial Average while the NYSE was closed. We collected the data for the 20 stocks in the new DJIA 20 Industrials and calculated the average of the bid and ask prices from August 24, 1914 to December 12, 1914. This enabled us to discover that the 1914 bottom for stocks actually occurred on November 2, 1914 when the DJIA hit 49.07, over a month before the NYSE reopened. Few people realize that stocks in the US had already bottomed out and were heading into a new bull market when the NYSE reopened on December 12, 1914. The DJIA did not revisit this level until the Great Depression in 1932. The graph below shows how the Dow Jones Industrial Average behaved during 1914, including the period of the NYSE’s closure. Although the market declined with the onset of war, investors eventually realized that war in Europe would bring opportunities to American companies to sell industrial goods and war materiel. Once this fact settled in, the stock market rose steadily for the next year.
The NYSE reopened trading for bonds under restrictions on November 28th; the San Francisco Stock and Bond Exchange reopened on December 1st; and the NYSE resumed trading at pegged prices on December 12th, though the prospect of war profits soon made these restrictions irrelevant.
As the graph below shows, the Dow Jones Industrial Average almost doubled in price in the year following its bottom in November 1914. The market paused, then had another rally into 1916 before falling back once investors realized the strong profits they had predicted from the war would not be realized.
The Closure of European Exchanges

In Europe, the problem of preventing catastrophic declines in stock prices was solved by putting a floor on share prices. Initially, stocks and bonds were not allowed to trade below the price they had been trading at on July 31, 1914. The government also placed restrictions on capital, limiting or preventing large flows of capital out of the country for the remainder of the war.
With these restrictions in place, markets reopened in Europe. The London Times began printing stock prices for London and Bordeaux on September 19th and for Paris on December 8, 1914. In January 1915, all shares were allowed to trade on the London Stock Exchange, though with price restrictions. The St. Petersburg exchange reopened in 1917 only to close two months later due to the Russian Revolution. The Berlin Stock Exchange did not reopen until December 1917.


