 The stock market declined 3% on August 14, 2019 because of the prospect that the yield curve was close to inverting between the 2-year note and the 10-year bond. Historically, when the yield on the 10-year bond has dipped below the yield on the 2-year bond, the inversion of interest rates portends a recession, and possibly a bear market in the near future. The yield on the 10-year bond is approaching 1.50% and could easily breach that level. The lowest yield the 10-year bond has ever been at is 1.37% which it reached in July 2016, but the yield could easily fall below that level soon.
The yield quickly bounced back after the July 2016 bottom, so it will be interesting to see whether interest rates remain low, as they did in 2012-2013, or bounce back as they did in 2016. Bond yields have been gradually declining since 1981 and there is no reason why they should have hit a permanent low. Yields below 1% are definitely possible given the low bond yields that prevail in Europe and Japan. The yield on the Swiss 10-year bond is currently below -1.00%.
Figure 1 provides a graph of the difference between the 10-year bond and 2-year note over the past 80 years with recessions overlaid to show that historically when the yield curve was inverted, a recession soon followed. But note that the recession didn’t begin until the yield curve became positive again.
The stock market declined 3% on August 14, 2019 because of the prospect that the yield curve was close to inverting between the 2-year note and the 10-year bond. Historically, when the yield on the 10-year bond has dipped below the yield on the 2-year bond, the inversion of interest rates portends a recession, and possibly a bear market in the near future. The yield on the 10-year bond is approaching 1.50% and could easily breach that level. The lowest yield the 10-year bond has ever been at is 1.37% which it reached in July 2016, but the yield could easily fall below that level soon.
The yield quickly bounced back after the July 2016 bottom, so it will be interesting to see whether interest rates remain low, as they did in 2012-2013, or bounce back as they did in 2016. Bond yields have been gradually declining since 1981 and there is no reason why they should have hit a permanent low. Yields below 1% are definitely possible given the low bond yields that prevail in Europe and Japan. The yield on the Swiss 10-year bond is currently below -1.00%.
Figure 1 provides a graph of the difference between the 10-year bond and 2-year note over the past 80 years with recessions overlaid to show that historically when the yield curve was inverted, a recession soon followed. But note that the recession didn’t begin until the yield curve became positive again.
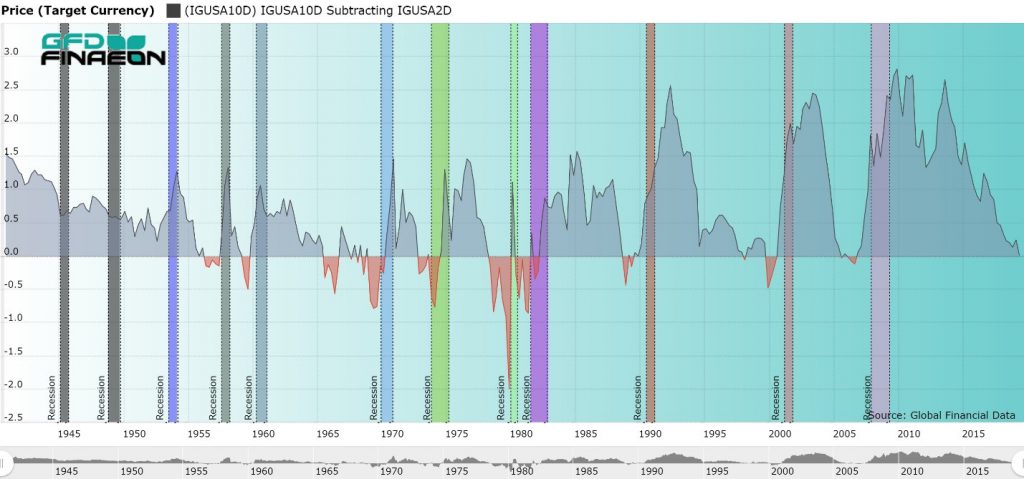
Figure 1. USA 10- and 2-year Government Bond Spread and Recessions
As can be seen, each of the recessions since 1950 were preceded by periods when the yield on the 2-year note exceeded the yield on the 10-year bond. There was one case where no recession followed, in 1965 and 1966, but with that one exception, every dip into a negative yield spread in the past was followed by a recession within a year. During the 1930s and 1940s, short-term interest rates were kept artificially low because of the Great Depression in the 1930s and World War II in the 1940s. If you go back to the 1920s, however, you can see that both the 1920-1921 recession and the 1929-1932 Depression were preceded by yield-curve inversions. Moreover, seven of the nine bear markets since 1950 were preceded by a yield inversion. The 1962 Steel Crisis and the 1987 Stock Market Crash were not preceded by a yield inversion, and no bear market followed the 1969 inversion. Given the evidence, the yield inversion between the 2-year note and 10-year bond is not a perfect indicator of future recessions and bear markets. However, over 80% of the time it does prove to be an accurate indicator. The yield started to invert earlier this year, and has slowly spread through the curve. The yield on the 30-year bond, at 1.98% is below 2% for the first time in history. The yield on the 30-year bond fell below the yield on the 2-year bond in 1989, 2000 and 2006, and could still fall below it later this year. The United States has gone ten years without the economy either falling into a recession or into a bear market. So certainly, by the law of averages, a recession or bear market in the near future is likely. The yield on the 10-year bond has not fallen below the yield on the 2-year note yet, but could soon. With an election coming up next year, it seems unlikely that politicians would allow a recession to occur during the next year, but since the last recession and bear market began right before the 2008 election, this is possible. Whether this occurs, only time will tell. Bear markets are clearly defined: a decline of 20% or more in an equity market constitutes a bear market. By this definition, the United States had 18 bear markets in the 1900s. But what is a bull market? Global Financial Data (GFD) has supplemented the definition of a bear market with the requirement that the intervening gain should show a rise of at least 50% before the 20% decline sets in. Otherwise, successive declines without a bounce back could be treated as multiple bear markets when actually there was only one long, extended bear market.
But what about fixed income markets? They go through bull and bear markets just like equity markets, but there is no definition of what would define a bull or bear market in fixed income markets. So let’s see if we can come up with rules for defining bull and bear markets in fixed-income markets. There are several facts that need to be considered.
Bear markets are clearly defined: a decline of 20% or more in an equity market constitutes a bear market. By this definition, the United States had 18 bear markets in the 1900s. But what is a bull market? Global Financial Data (GFD) has supplemented the definition of a bear market with the requirement that the intervening gain should show a rise of at least 50% before the 20% decline sets in. Otherwise, successive declines without a bounce back could be treated as multiple bear markets when actually there was only one long, extended bear market.
But what about fixed income markets? They go through bull and bear markets just like equity markets, but there is no definition of what would define a bull or bear market in fixed income markets. So let’s see if we can come up with rules for defining bull and bear markets in fixed-income markets. There are several facts that need to be considered.
Bull and Bear Fixed Income Cycles
First, there is a greater correlation between individual fixed income instruments than between individual equities. If interest rate yields rise on a particular day and bond prices fall, almost all bond prices will fall. In bond markets, you lack the dispersal of advances and declines that occur in the equity markets. Over time, risk spreads between different bonds will rise and fall. During a recession when the risk of default increases on low quality bonds, the yield difference between AAA and BB bonds widens, but during a strong market, this difference shrinks. Maturity also influences relative interest rates. As is well known, the yield curve which measures the spread between short-term and long-term bonds, is usually positive. However, as the economy approaches a recession, short-term yields can exceed long-term yields and act as an indicator of a pending recession. Second, bull and bear markets are generally longer for fixed income instruments than for equities. The reason for this is that three things generally drive interest rates: risk of default, maturity and inflation. Equities, on the other hand, are typically driven by anticipated future earnings. When a recession is looming and investors anticipate that future earnings will decline, shares can decline in price quickly. When the recession is over and earnings return, the price of equities can rise dramatically. There were 18 bear markets in the United States in the 1900s, meaning that one occurred every five or six years. However, if you look at bond yields, the rises and falls in the yield on the 10-year bond stretches over longer time periods. Bond yields fell from the 1780s to 1830s, rose until the Civil War in the 1860s, declined to around 1900, rose until 1920, declined to 1950, rose to 1981 and have declined steadily since then. Bull and bear markets in equities may last around 6 years, but bull and bear markets in fixed income markets last 40 or 50 years. The current rise and fall began in 1945 and has lasted almost 75 years. Bond yields have been declining since 1981 and there is no evidence that they have hit their bottom. Bond yields are negative in some European countries and there is no guarantee that bond yields couldn’t also turn negative in the United States at some point in the future. Bond yields could theoretically remain low or continue their decline for another decade. Risk and reward work in opposite directions for short-term and long-term fixed-income investors. For short-term holders of Treasury Bills, there is virtually no default risk, but there is reinvestment risk. When interest rates are rising, this works to the advantage of investors who are likely to receive a higher return when they reinvest their money after the 3-month T-bills mature. When short-term yields are falling, investors will receive a lower return when they reinvest their money. On the other hand, rising bond yields mean lower bond prices, reducing the return to investors. Hence, a bull market for short-term holders of T-bills is a bear market for long-term holders of 10-year Treasury Bonds. Figure 1 compares the yield on the 10-year Government bond with the yield on 3-month Treasury Bills over the past 100 years. Short-term yields are usually less than long-term yields. The long-term pattern of rising and falling yields over a period of several decades is visible. In addition to this, it can be seen that short-term rates are more volatile than long-term rates, rising above long-term rates as a prelude to a recession and plunging below long-term rates once the economy recovers.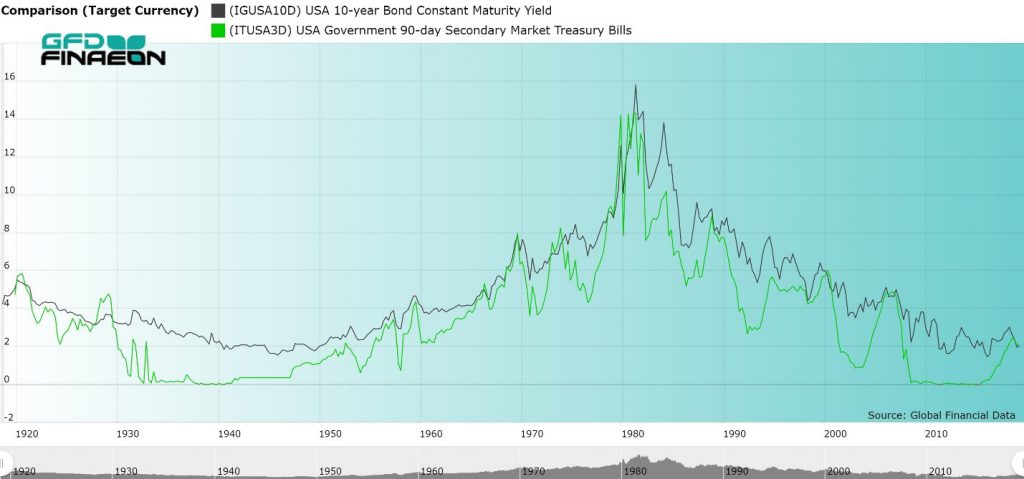
Figure 1. Yields on 10-year Bonds and 3-month T-bills, 1919 to 2019
Although there have been only two bull and bear markets in 10-year bonds over the past 100 years, there have been 17 bull and bear markets in 3-month Treasury Bills over the past 100 years. But how would you define a bull and bear market in Treasury bills? We say that in order for there to be a bull or bear markets, you need to have at least a 200-basis point move up or down in the yield. Although 10-year bond yields have been in a downward trend since 1981, there have been dramatic moves up and down in the yield over time. If you were to limit yourself to 200-basis point moves in the 10-year bond, you would find that there have been six bear markets in 10-year bond yields since 1981, not one. Unfortunately, this definition might have limited usefulness in the future. With bond yields falling below 2% in recent years, it would be difficult to sustain a 200-basis point move. Table 1 provides the broad moves in 3-month Treasury Bills over the past century. Generally, a bull-bear market cycle in yields occurred about every five years, which is mainly a reflection of recessions occurring about every five years. Since 2000, however, the time required for the market to move through one of its bull-bear market cycles has increased to around 10 years.| Date | Yield | Decline | Date | Yield | Increase |
| 12/31/1920 | 5.875 | 5.875 | |||
| 8/31/1924 | 1.9 | 3.975 | 5/31/1929 | 5.09 | 3.19 |
| 7/31/1931 | 0.41 | 4.68 | 1/31/1932 | 2.681 | 2.271 |
| 12/31/1932 | 0.085 | 2.596 | 3/31/1933 | 2.289 | 2.204 |
| 1/5/1940 | 0 | 2.29 | 5/8/1953 | 2.29 | 2.2899 |
| 6/7/1954 | 0.61 | 1.68 | 10/16/1957 | 3.67 | 3.06 |
| 5/27/1958 | 0.55 | 3.12 | 1/6/1960 | 4.68 | 4.13 |
| 7/1/1960 | 2.05 | 2.63 | 9/21/1966 | 5.59 | 3.54 |
| 6/23/1967 | 3.33 | 2.26 | 12/29/1969 | 8.08 | 4.75 |
| 2/11/1972 | 2.99 | 5.09 | 8/23/1974 | 9.74 | 6.75 |
| 12/20/1976 | 4.24 | 5.5 | 3/25/1980 | 16 | 11.76 |
| 6/13/1980 | 6.18 | 9.82 | 12/11/1980 | 17.14 | 10.96 |
| 8/20/1982 | 7.08 | 10.06 | 8/27/1984 | 10.67 | 3.59 |
| 10/8/1986 | 5.04 | 5.63 | 3/27/1989 | 9.1 | 4.06 |
| 10/1/1992 | 2.61 | 6.49 | 2/1/1995 | 5.9 | 3.29 |
| 10/16/1998 | 3.56 | 2.34 | 11/6/2000 | 6.24 | 2.68 |
| 6/19/2003 | 0.8 | 5.44 | 2/20/2007 | 5.05 | 4.25 |
| 9/22/2011 | 0 | 5.05 | 3/21/2019 | 2.49 | 2.49 |
Table 1. Bull and Bear Market Cycles in 3-month U.S. Treasury Bills
The historical record on yield cycles for 10-year Treasury Bonds is provided in Table 2. As can be seen, the time cycles are longer than the 3-month cycles and the definition of a cycle depends upon the definition of how much of a move is required to define a bull-bear market cycle. There hasn’t been a 200-basis move up since the 2007 Great Recession occurred. And again, the move up from 1945 to 1981 could be defined as one long, extended increase in interest rates and the move since 1981 as one long move down. Moreover, there is no guarantee that interest rates have bottomed out and a new bear market in the price of 10-year bonds has begun. The yield on 10-year bonds has turned negative in both Europe and Japan and there is no reason why the same couldn’t happen in the United States. Only time will tell whether 2% moves up and down lie in our future.| Date | Yield | Decline | Date | Yield | Increase |
| 03/31/1788 | 24.615 | ||||
| 01/31/1792 | 3.956 | 20.659 | 09/30/1798 | 7.059 | 3.103 |
| 07/31/1802 | 4.511 | 2.548 | 10/31/1814 | 5.882 | 1.371 |
| 09/30/1832 | 2.996 | 2.886 | 05/31/1861 | 7.059 | 4.063 |
| 3/31/1902 | 2.86 | 4.199 | 8/30/1920 | 5.67 | 2.81 |
| 11/30/1945 | 1.55 | 4.12 | 10/31/1957 | 3.97 | 2.42 |
| 4/30/1958 | 2.88 | 1.09 | 8/7/1975 | 8.48 | 5.6 |
| 12/30/1976 | 6.8 | 1.68 | 2/26/1980 | 13.65 | 6.85 |
| 6/16/1980 | 9.47 | 4.18 | 9/30/1981 | 15.84 | 6.37 |
| 5/4/1983 | 10.12 | 5.72 | 5/30/1984 | 13.99 | 3.87 |
| 8/29/1986 | 6.95 | 7.04 | 10/16/1987 | 10.23 | 3.28 |
| 10/15/1993 | 5.19 | 5.04 | 11/7/1994 | 8.05 | 2.86 |
| 12/10/1998 | 4.53 | 3.52 | 1/20/2000 | 6.79 | 2.26 |
| 6/13/2003 | 3.13 | 3.66 | 6/12/2007 | 5.26 | 2.13 |
| 12/18/2008 | 2.08 | 3.18 | 4/5/2010 | 4.01 | 1.93 |
| 7/25/2012 | 1.43 | 2.58 | 12/31/2013 | 3.04 | 1.61 |
| 7/5/2016 | 1.37 | 1.67 | 11/8/2018 | 3.24 | 1.87 |
Table 2. Bull and Bear Market Cycles in U.S. 10-year Treasury Bonds
Conclusion
Although investors typically think of bull and bear markets as occurring in equity markets, fewer people think of there being bull and bear markets in fixed income. Rising interest rates work to the benefit of short-term investors and against long-term investors since higher yields translate to lower bond prices. Different factors drive bull and bear markets in equities, short-term bills and long-term bonds. Bull and bear markets in equities are driven by earnings. Fears of a recession and lower earnings lead to a bear market correction. Long-term bonds reflect yield expectations over the life of a bond. Lower inflation and lower growth lead to lower interest rates and lower yields. Short-term interest rates are driven by booms and recessions in the economy. As the economy booms, short-term interest rates rise and as the economy slips into a recession, short-term interest rates fall. Just as there has to be a definition of a bull and bear market in equity markets, which we define as a 20% decline in an index for a bear market and a 50% increase in an index for a bull market, there has to be a definition of a bull and bear market in fixed-income. We have defined this as a 200-basis point move either up or down. This definition worked during the nineteenth and twentieth centuries, but with interest rates falling to almost zero for 3-month T-bills and below 2% for 10-year Treasury Bonds, this definition begins to sound inadequate. How can there be a 200-basis point move when yield fluctuate between 0% and 2%? Perhaps going forward, the definition should be changed to a 100-basis point move. Nevertheless, there is no evidence that long-term interest rates have hit a bottom or that during the next decline in short-term yields, 3-month Treasury bills won’t provide a negative return as is currently the case in Europe. There were 25 years between the 10-year interest rate peak in 1920 and the bottom in 1945. The rise to 1981 took 36 years, and interest rates have been declining over the past 38 years. With yields hitting all-time lows in Europe, it seems unlikely that the current cycle has come to an end. How much longer it will be before a new multi-decade bear market in long-term bond yields begins, no one knows. During the 1800s, the transport and finance sectors represented the majority of the stock market capitalization in the United Kingdom. As Figure 1 shows, in 1800, finance represented about 90% of stock market capitalization. This fell to around 60% in 1807 when data on canals became available, and 35% in the 1840s when the Railway Mania occurred. Similarly, transports represented about 30% of stock market capitalization between 1807 and the 1830s, rising to over 50% when the Railway Mania occurred in the 1840s. Transports represented about half of the stock market capitalization for the rest of the century. However, in 1924, Britain’s railways were merged into four main lines and after World War II, the railroads were nationalized. It was mainly after 1900 that sectors other than transports or finance began to play an important role in the British economy.
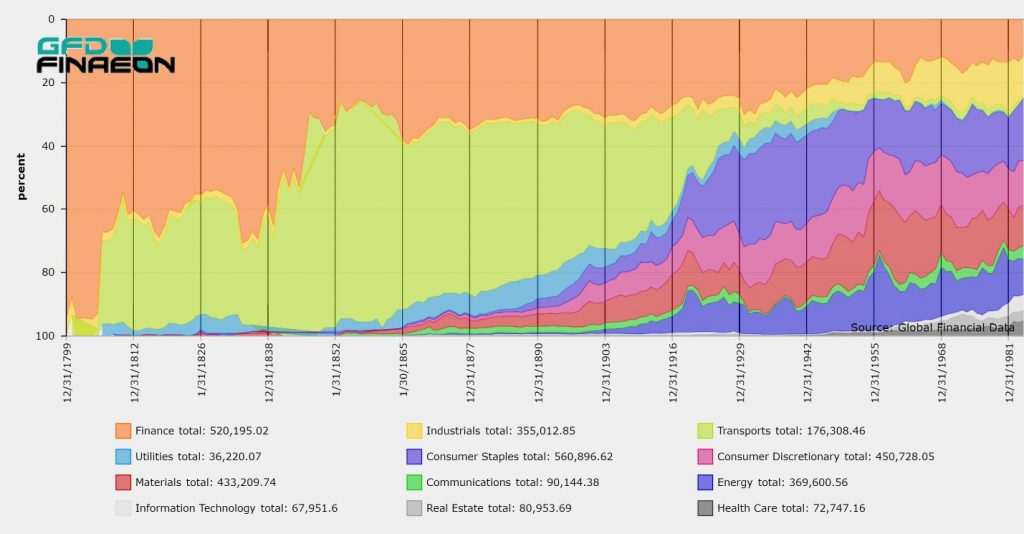
Figure 1. Shares of Stock Market Capitalization by Sector in the United Kingdom, 1800 to 1985
Figure 2 illustrates the performance of the Transport sector, the Finance sector and all stocks, as represented by the UK-100 in the 1800s. The most interesting fact revealed by the chart is the changing role of transport stocks in the 1800s. During the first 50 years, transports had more dramatic moves than the rest of the market, reflecting the speculative nature of investing in canals and railroads relative to the rest of the market. The Finance index mirrored the UK-100 index until 1840 because banks represented such a large portion of the total capitalization. Beginning with the Railway Mania of the 1840s, the UK-100 index no longer mirrored the performance of finance stocks. After 1850, transportation stocks represented about 60% of total market cap so there was a strong correlation between transports and the rest of the market. The UK-100 index had three bear markets in the 1800s between December 1809 and October 1812 (down 20.1%), between April 1824 and November 1831 (down 28.7%) and between June 1845 and April 1850 (down 34%). The Transport index had bear markets between June 1810 and October 1816 (down 41.2%), between October 1824 and November 1831 (down 36.2%), between July 1845 and April 1850 (down 57.3%), and between November 1852 and October 1855 (down 23.4%). Transport stocks also had more dramatic moves up in the 1820s (108% vs. 56.9%) and in the 1840s (69.1% vs. 36.3%) than the UK-100 index. As these numbers and Figure 2 reveal, transport stocks were more volatile than the rest of the market between 1807 and 1850.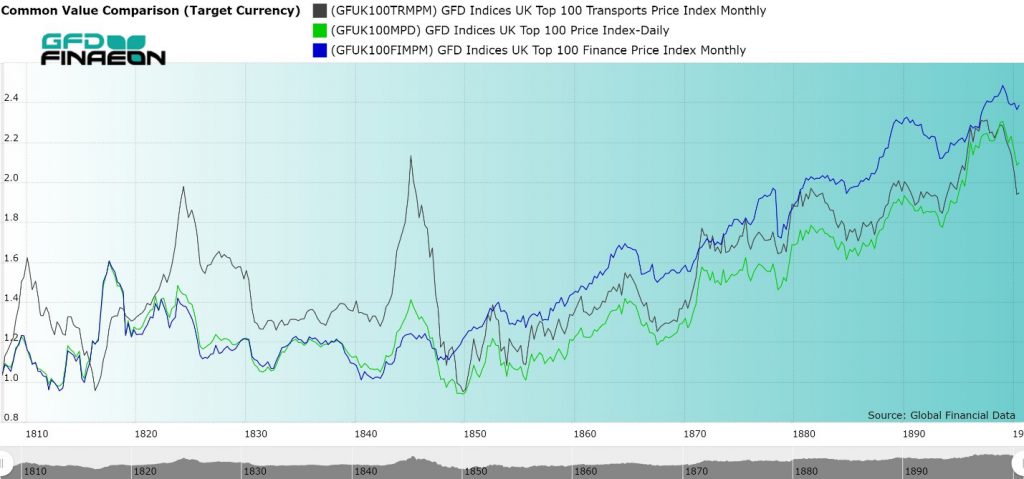
Figure 2. Transports, Finance and UK-100 Indices, 1807 to 1900
Four Transportation Bubbles
Transportation stocks went through four bubbles in the late 1700s and early 1800s. The first was the Canal Bubble of 1793. Canal stocks were issued in limited quantities to shareholders in the Midlands and the stocks were not really traded in London, so very little data exists on the price movements that occurred during the Canal Bubble; however, we do have data for some of the larger stocks, such as the Birmingham Canal, which shows that many of the stocks quadrupled in price before sinking back to par after the bubble ran its course. The second canal bubble occurred between 1806 and 1810. Luckily, we do have data on this bubble, at least the last three years of it. Canal stocks rose 65% between 1807 and 1810 before giving back all of the gains over the next five years. A third canal bubble occurred after the Napoleonic wars ended in 1815 and capital flowed to the canals to help rebuild the country. Similar bubbles in South American stocks and mining stocks also drove the market bubble in 1824 before stocks collapsed in 1825. Many of the South American mining stocks lost almost all of their value in the 1825 crash and South American countries that issued bonds in London ended up defaulting on their loans. The Railway Mania of the 1840s was the final transportation bubble of the 1840s. Hundreds of new railroads were registered and capital flowed into the new iron roads. The growth of the railroads came at the expense of the canals which declined in price while the price of railroads rose. Railroad companies used every technique they could think of to raise capital, issuing partial shares to lower the price and issuing preferred shares that received dividends before the ordinary shares got paid. Shares were issued at £100 par which was equal to a year’s salary for some people in the 1840s. So lowering the price of shares by dividing them into halves, fourths, tenths or even sixteenths enabled small investors to benefit from the Railway Mania and helped railroads to raise capital. The size of the transportation sector tripled between 1838 and 1846 rising to £60 million in market capitalization. When the Railway Mania ended in 1845, the railroads spent the next two decades picking up the pieces of their mad dash for capital. Fractional shares were converted into whole shares, smaller railways were taken over by larger railways, and shares that were below par were converted into full par shares through reverse splits. Shares in auxiliary railroads were converted into shares in the main company. After 1850, no more bubbles occurred in transportation stocks as the focus turned to consolidating the UK’s railways, not creating new ones. By the 1860s, the London and Northwestern Railway was not only the largest stock by capitalization in the United Kingdom, exceeding the size of the Bank of England, but the largest corporation in the world. The London and Northwestern held that title until the 1890s when Standard Oil became the largest corporation in the world. Railroads continued to consolidate until World War I, merged into four railroads in 1923 and were nationalized in 1946.One Hundred Years of Railways
Railway stocks not only transformed the stock market in the United Kingdom, but the rest of the world. In the United Kingdom, United States, France and other countries, railways attracted so much capital in the 1830s and 1840s that railways completely dominated trading in those countries. Railways were able to increase dividends dramatically as they grew, and shareholders saw the opportunity for long-term capital gains, not just steady dividends. In some ways, stock markets never recovered from the Railway Mania of the 1840s. Railway companies realized they could use aggressive techniques to take over other companies and expand their operations in a way that finance companies could not. Shareholders got the taste for capital gains and began focusing on buying companies that would not only pay rising dividends, but which would rise in price as well. The hundred years between the collapse of the Railway Mania in 1846 and the nationalization of the railways in Britain in 1946 was a century in which railways dominated the stock market in the United Kingdom. No industry will ever play as prominent a role in the British economy again. The House of Representatives has begun an inquiry into impeaching President Trump. This will make Trump only the fourth President to face an impeachment inquiry. Andrew Johnson was impeached in 1868, but the Senate failed to remove him from office by one vote. President Nixon faced impeachment in 1974, but resigned rather than be removed from office. President Clinton was impeached in 1998, but the Senate failed to remove him from office. Although there are sufficient votes to pass articles of impeachment against President Trump, since the Democrats have a majority of the seats in the House, because the Republicans control the Senate, it would be unlikely that President Trump would be removed from office.
While the stock market generally declined during the Watergate Hearings and the impeachment of President Nixon, the market rose during the impeachment and trial of President Clinton, but what happened during the impeachment of President Johnson? The S&P Composite as extended by the Cowles Commission only goes back to 1871, so no record of the performance of the market in 1868 exists. However, Global Financial Data has calculated a daily record of the stock market between 1830 and 1900 by calculating the GFD Railroad Index. Railroads represented most of the active stocks on the New York Stock Exchange in 1868. This index can reveal how the market reacted to the impeachment of President Johnson.
The House of Representatives has begun an inquiry into impeaching President Trump. This will make Trump only the fourth President to face an impeachment inquiry. Andrew Johnson was impeached in 1868, but the Senate failed to remove him from office by one vote. President Nixon faced impeachment in 1974, but resigned rather than be removed from office. President Clinton was impeached in 1998, but the Senate failed to remove him from office. Although there are sufficient votes to pass articles of impeachment against President Trump, since the Democrats have a majority of the seats in the House, because the Republicans control the Senate, it would be unlikely that President Trump would be removed from office.
While the stock market generally declined during the Watergate Hearings and the impeachment of President Nixon, the market rose during the impeachment and trial of President Clinton, but what happened during the impeachment of President Johnson? The S&P Composite as extended by the Cowles Commission only goes back to 1871, so no record of the performance of the market in 1868 exists. However, Global Financial Data has calculated a daily record of the stock market between 1830 and 1900 by calculating the GFD Railroad Index. Railroads represented most of the active stocks on the New York Stock Exchange in 1868. This index can reveal how the market reacted to the impeachment of President Johnson.
Impeachment!
The impeachment of Andrew Johnson was driven by differences between the Radical Republicans, who favored reconstruction, requiring southern states to enact new constitutions, ratify the Fourteenth Amendment and guarantee voting rights for black males and those who were sympathetic to the defeated rebels. Edwin M. Stanton was a staunch Radical Republican who had been appointed as Secretary of War under Abraham Lincoln and remained in office after Lincoln’s assassination. To ensure that Johnson did not get rid of Stanton, Congress passed the Tenure of Office Act in 1867 over Johnson’s veto. The Act required the President to seek the Senate’s advise and consent before removing any member of his Cabinet or any official who had required the Senate’s advise and consent before being appointed. Johnson suspended Stanton from office on August 5, 1867 and appointed Ulysses S. Grant in his place. The Senate reinstated Stanton in January 1868 and Grant resigned. On February 21, 1868, Johnson ordered the removal of Stanton from office and appointed Lorenzo Thomas as his successor. On February 24, the House of Representatives voted 126 to 47 to impeach President Johnson on eleven articles of impeachment. The Articles of Impeachment were presented to the Senate on March 4, 1868. The proceedings began on March 23 and the trial on March 30. At the time, there were 54 members of the Senate representing 27 states. The 10 Confederate states were not part of the Union. On May 16, the Senate voted on the Articles of Impeachment which required a two-thirds majority to pass and remove Johnson from office. Three Articles of Impeachment were voted on and each were passed by 35-19; however, this fell one vote short of the two-thirds requirement and Johnson was not removed from office. The vote weakened the President at the expense of the Congress, but the failure to remove Johnson from office reduced the likelihood that a President could be impeached for purely political reasons.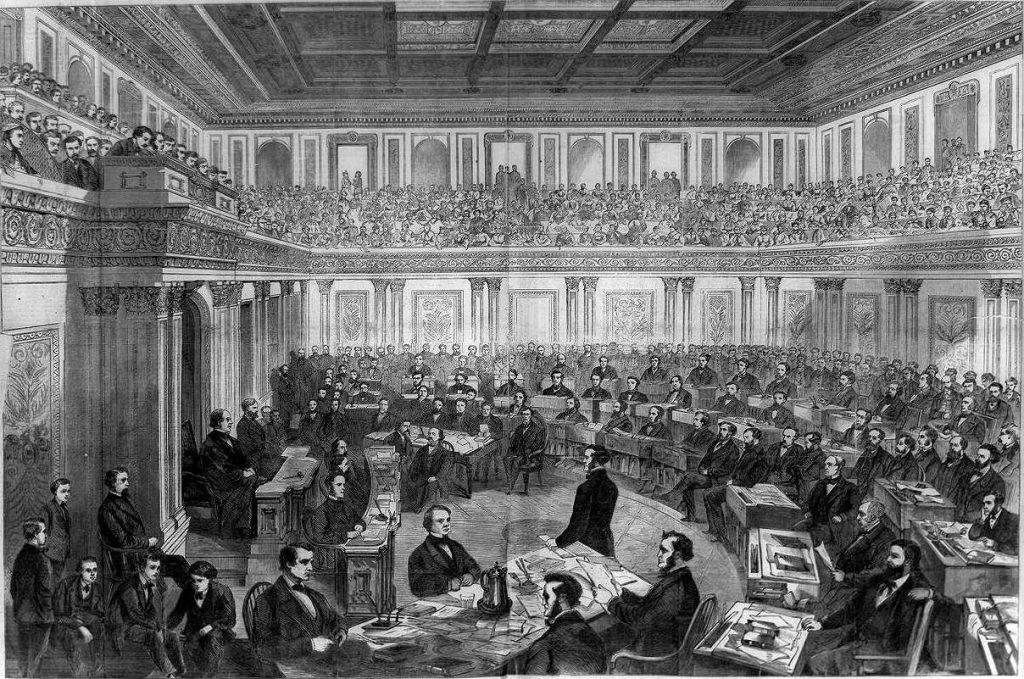
The Market
How did the stock market behave during the trial? The GFD Rail index had begun the year at 11.07 and had risen to 11.65 by the time that Johnson removed Stanton from office on February 21. The market actually rose in price between then and March 4 when the Articles of Impeachment were presented to the Senate. The market declined until April 20 when the Rail Index dipped below 11; however, the market recovered to 11.66 when the first Senate vote failed to remove Johnson from office, and to 11.89 when the second vote failed to remove Johnson from office. The market moved up from there, peaked on June 27, and declined after that.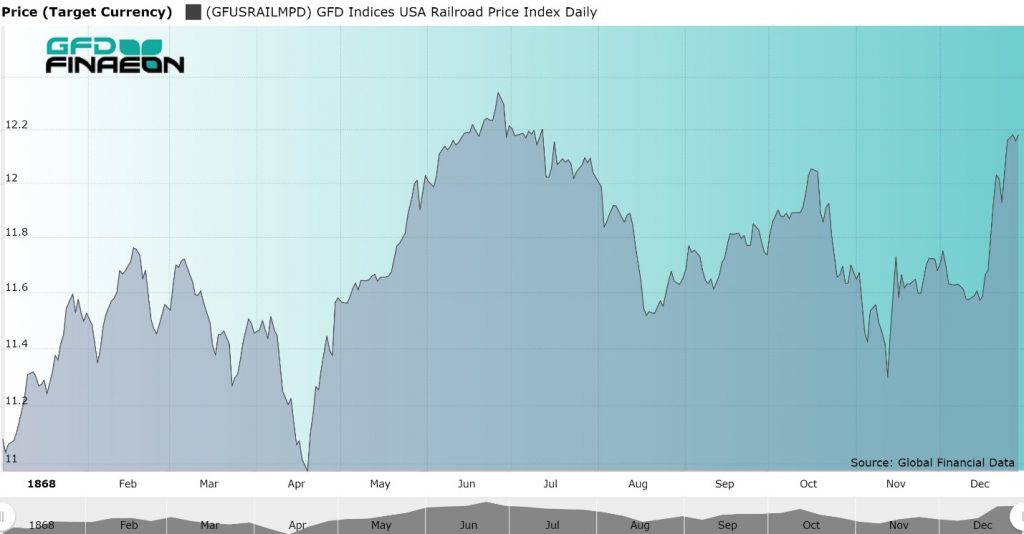 The failure to find Johnson guilty clearly impacted the stock market, driving it down in price while Johnson was on trial in the Senate, but rising in value as the Senate failed to remove him from office. The Tenure of Office Act was repealed by the Senate in 1887. As Lyman Trumball of Illinois, who voted for acquittal, noted, the failure to remove Johnson from office preserved one of the President’s most important rights – to disagree with Congress without there being any consequences.
Because President Johnson was opposed by the Radical Republicans, he did not receive any support at the Republican National Convention, and Ulysses S. Grant was chosen unanimously as the Republican candidate on the first ballot. Ulysses S. Grant went on to win the election in November and served as President for the next four years.
The failure to find Johnson guilty clearly impacted the stock market, driving it down in price while Johnson was on trial in the Senate, but rising in value as the Senate failed to remove him from office. The Tenure of Office Act was repealed by the Senate in 1887. As Lyman Trumball of Illinois, who voted for acquittal, noted, the failure to remove Johnson from office preserved one of the President’s most important rights – to disagree with Congress without there being any consequences.
Because President Johnson was opposed by the Radical Republicans, he did not receive any support at the Republican National Convention, and Ulysses S. Grant was chosen unanimously as the Republican candidate on the first ballot. Ulysses S. Grant went on to win the election in November and served as President for the next four years.
