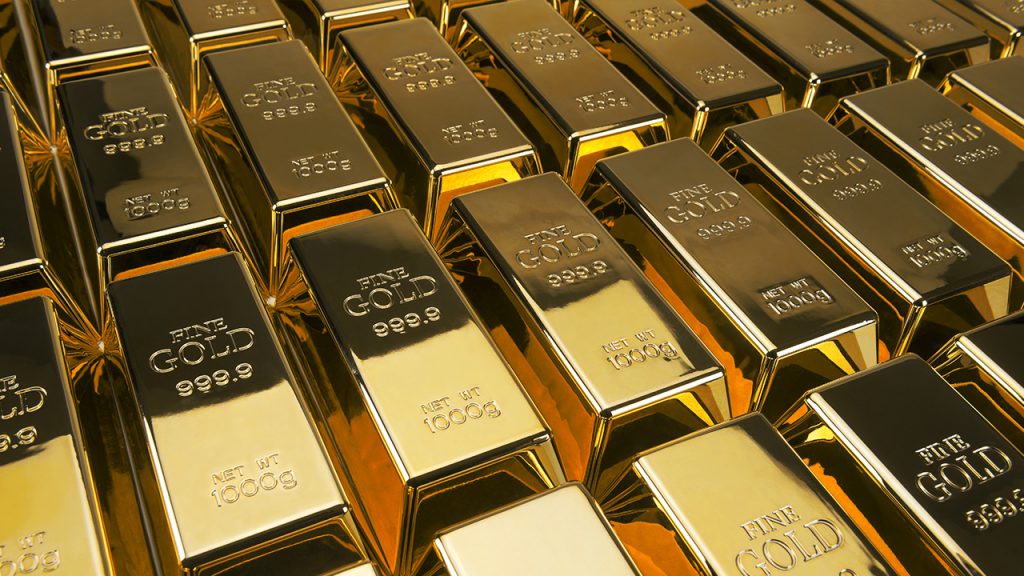
 We recently wrote a blog on Tom Moore’s Distillery which along with Park and Tilford and the National Distillers Products Corp. paid dividends in whiskey to their shareholders. Companies are not required to pay out cash dividends, and they can pay out in-kind dividends in any way they want. Back in the 1980s, Ranchers Exploration and Development Corp. paid their dividends in bars of gold and silver!
From Uranium to Copper to Silver
Ranchers Exploration and Development Corp. incorporated in New Mexico in 1954. The company operated several uranium mines in New Mexico and Utah. Its principal uranium mine was the Johnny M Mine located near Granta, New Mexico. The company also mined uranium from the Small Fry Mine located near Moab, Utah, and mined cathode copper at its Bluebird Mine near Miami, Arizona. However, two of the company’s mines produced precious metals. The company conducted placer operations for gold in Alaska, developed the Escalante Silver Mine in southwest Utah and the Revenue Virginius Silver Mine near Ouray, Colorado. During the first ten years of its existence, the Ranchers Exploration mines failed to generate any significant results, but in 1966, the Bluebird Copper Mine began to produce large amounts of copper and the price of the stock shot up from $5 per share in 1966 to $70 per share in 1967. The company used their increased valuation to acquire the Big Mike Corp. and expand its operations. In 1970, the company moved from the over-the-counter market to a listing on the American Stock Exchange where it stayed for the next 14 years. Ranchers Exploration and Development Corp. is another example of a company that made its major move over-the-counter before moving onto an exchange. By 1971, the company’s sales had risen from $400,000 in 1963 to over $15 million in 1971, and to over $30 million by 1978. The company had 2-for-1 splits in 1970 and 1980 and a 3-for-2 split in 1983.
The stock’s next big move came in 1980 after the company discovered silver at the Escalante Silver Mine and the price of silver was pushed to unprecedented heights. It should be remembered that the Hunt Brothers and their Saudi investors put the squeeze on silver in 1979 and 1980 trying to corner the market and profit from the millions of ounces they had had delivered to them. The Hunts were able to drive the price of silver up from $6 at the beginning of 1979 to $51 in January 1980 when the price of silver peaked before dropping precipitously to $11 by March of 1980.

Pay Me in Bars of Gold and Silver!
Ranchers Exploration read the writing on the wall and began offering to pay dividends not in US Dollars, but in gold and silver, in part to attract shareholders to their stock. The Dutch East India Company had regularly paid in-kind dividends to its shareholders in the 1600s and the Ranchers Development and Exploration Corp. decided to follow in their footsteps. The June 1981 dividend was payable in 2.5 grams of gold for every 500 shares held. Holders who owned 6,221 shares received a one-ounce gold bar. Cash equal to $0.0766 was paid for fractional shares. The September 1981 dividend was payable in 2.5 grams for each 400 shares held. Holders of 4,997 shares received a one-ounce bar in gold. Gold was selling at $600 an ounce on June 8, 1981 and $700 an ounce on September 24, 1981. In 1981, Ranchers Exploration had about three million shares outstanding, so the company would have paid out about 600 ounces in gold. In December, the company switched from gold to silver, and shareholders received a one-ounce bar of silver for every 120 shares that they owned. This would mean that the company paid out 25,000 ounces of silver to its shareholders. The March and June 1982 dividends were also payable in silver at the rate of 1 ounce of silver for each 120 shares, the September 1982 at the rate of 1 ounce of silver for each 100 shares, and the December 1982 dividend was payable in gold at the rate of 1 ounce of gold for every 4,977 shares. The 1983 dividends were payable at the rate of 1 ounce of silver for each 100 shares owned and the 1984 dividends were payable at the rate of 1 ounce of silver for each 150 shares owned. Investors who were tired of getting paid in dollars that were rapidly losing their value to inflation piled into the stock. The price of Ranchers Exploration shares gyrated with the price of gold and silver as the graph above illustrates. The stock price fell from over $65 at its peak in April 1981 to $12.50 in March 1982 and rose up to $53 ($35.25 after the 3-for-2 split) in April 1984. Other corporations saw value in the company, and on July 27, 1984, Ranchers Exploration and Development Corp. was acquired by Hecla Mining with shareholders receiving 1.55 shares of Hecla Mining Co. common stock, equivalent to about $21 in cash. Hecla Mining did pay dividends to its shareholders, but in cash, not in gold or silver. Nevertheless, I would imagine that some of the former shareholders still probably hold bars of gold and silver they received from Ranchers Exploration and Development Corp. when it paid its dividends in bars of gold and silver. Sears Holding Co. filed for protection under Chapter 11 bankruptcy on October 15, 2018 to avoid a $134 million debt payment. Thus, an American icon which issued its first catalog in 1887 and opened its first store in 1925 came to an end. Between 1906 when the company had the largest retail IPO in the United States up until that time and 1972 when the stock peaked, Sears’ stock market capitalization increased over 1200-fold from $15 million in 1906 to $18 billion in 1972. The stock price rose 2000-fold providing a 12% annual return between 1908 and 1972. After reinvesting dividends, $1 invested in Sears in 1908 grew to over $20,000 by 1972 providing an annual return over 16%, making Sears one of the greatest investments in American history. The company was bought out by K-Mart in 2005 and since 2007, Sears Holding Corp. stock has seen a steady decline from $195 in 2007 to 30 cents today.
Sears, which had led the retail market from the 1890s to the 1970s was unable to find its retail focus and became a shadow of its former self. Sears did innovate and introduce new products and lines, but this only delayed the inevitable collapse of the company. Sears has been unable to reinvent itself during the past 50 years and instead of other retailers following in its footsteps, it tried to imitate its competitors and ultimately failed. Today, however, Amazon is the Sears of the twenty-first century and one wonders whether Amazon will repeat Sears’ mistakes in the years to come.
Sears Holding Co. filed for protection under Chapter 11 bankruptcy on October 15, 2018 to avoid a $134 million debt payment. Thus, an American icon which issued its first catalog in 1887 and opened its first store in 1925 came to an end. Between 1906 when the company had the largest retail IPO in the United States up until that time and 1972 when the stock peaked, Sears’ stock market capitalization increased over 1200-fold from $15 million in 1906 to $18 billion in 1972. The stock price rose 2000-fold providing a 12% annual return between 1908 and 1972. After reinvesting dividends, $1 invested in Sears in 1908 grew to over $20,000 by 1972 providing an annual return over 16%, making Sears one of the greatest investments in American history. The company was bought out by K-Mart in 2005 and since 2007, Sears Holding Corp. stock has seen a steady decline from $195 in 2007 to 30 cents today.
Sears, which had led the retail market from the 1890s to the 1970s was unable to find its retail focus and became a shadow of its former self. Sears did innovate and introduce new products and lines, but this only delayed the inevitable collapse of the company. Sears has been unable to reinvent itself during the past 50 years and instead of other retailers following in its footsteps, it tried to imitate its competitors and ultimately failed. Today, however, Amazon is the Sears of the twenty-first century and one wonders whether Amazon will repeat Sears’ mistakes in the years to come.
The First Sears Catalog
Sears was originally a watch business, just as Amazon was originally a book business. Its founder, Richard W. Sears worked as a freight agent for the Minneapolis and St. Louis Railroad in 1886 when a local jeweler gave him an unwanted shipment of pocket watches which Sears resold. Sears bought and resold more watches and soon quit his railroad job to form the R.W. Sears Watch Co. in Minneapolis. Sears hired Alvah Roebuck as a watch repairman in 1887, moved to Chicago in 1887, and in 1888 published his first mail-order catalog. By 1890, the 80-page catalog had grown to 322 pages and by 1895 to 532 pages. Anyone wanting to understand what life was like in America 100 years ago need only purchase one of the reproductions of a Sears catalog to see the thousands of goods people were able to buy. Unfortunately, no Amazon catalog will exist 100 years from now. Sears bought out Roebuck in 1893 and recapitalized the company at $150,000 with two new partners, Aaron Nusbaum and Julius Rosenwald. Sears was a classic entrepreneur and always pushed to expand the company. As one person put it, Sears could “probably sell a breath of air.” In the nineteenth century, America was still a rural country. Farmers had to buy their goods at the local general store, pay high prices and have little choice in what they could buy. However, Sears offered a large catalog with hundreds of pages of items that farmers needed and wanted. Sears provided an unconditional money-back guarantee for all of the items in the catalog and his willingness to accommodate his customers at every level paid off. As Sears once put it, “Honesty is the best policy. I know it. I’ve tried it both ways.” Sears sold on a low margin to get rural America hooked on buying through the mail rather than go to the local general store, and his plan succeeded. Sears enjoyed phenomenal growth for the next 30 years. Two postal changes helped Sears to penetrate the rural market. The Rural Free Delivery Act was introduced in 1896 and parcel post was introduced in 1913. Before Rural Free Delivery, farmers had to go to distant post offices to pick up packages. In fact, before 1863, all letters were delivered from one post office to another post office. No home delivery existed. Beginning in 1863, mail was delivered to homes in major cities, and in 1896, mail was delivered directly to rural farms, but 4 pounds was the limit on the size of packages delivered by the post office. All other goods had to be shipped by railway freight or railway express. Before parcel post, four express companies divided up the delivery market between them with little competition. The government wanted to destroy this cartel and in 1913, the post office began delivering parcel post across America. Once the post office entered the business, companies like Sears could mail packages to anyone anywhere in the United States. Both of these changes made it easy for Sears to send millions of items through the mail to eager customers in rural areas.Sears Conducts the Largest Retail IPO
1906 brought two major changes to Sears. First, Sears established its distribution through its Sears Merchandise Building in Chicago, which covered 3 million square feet, and which symbolized Sears dominance of the mail order business. The building remained the corporate headquarters for the company until the Sears Tower was built in the 1970s. Second, Sears reincorporated in New York and went public, issuing shares at $50 a share and increasing the company’s capitalization to $15 million, a 100-fold increase over 1893. But this was just the beginning of Sears’ growth. By 1929, Sears reached a market capitalization of $775 million, 50 times greater than in 1906. Sears clearly used the capital it raised in 1906 and after to expand the company throughout the United States. Consequently, sales grew six-fold between 1906 and 1920 and in 1911, Sears began offering credit to its customers to increase its sales even more. By the 1920s, the population of the United States was moving off the farms and into the cites and suburbs. Sears hired Robert Ward, the “General” (since he had served as the U.S. Army’s Quartermaster General during World War I), from Montgomery Ward in 1924 and Ward drove the growth of Sears over the next 30 years. One of the main innovations that Ward introduced in 1925 was to have physical stores where customers could buy their goods directly from Sears rather than wait for the goods to be delivered by the post office. Using the U.S. Census and the Statistical Abstract of the United States, Robert Ward plotted where to build retail stores to maximize Sears’ growth. Montgomery Ward followed suit in 1926 and opened its first store. Sears was added to the Dow Jones Industrial Average in 1924 and remained a member until 1999. The key to Sears’ success was to open up stores in the suburbs, not in the city centers where Sears would have had to compete with high-end department stores. Sears made their stores easily accessible to motorists with free parking. Montgomery Ward built their stores in rural areas and Woolworth focused on urban centers, but Sears built their stores in the suburbs where people were moving to. The introduction of the stores was a huge success and by 1930, only five years later, Sears operated over 300 stores nationwide. By 1931, store sales exceeded catalog sales. Sears began working more closely with its suppliers, converting the Nineteen Hundred Corp. into Whirlpool, and in 1931 Allstate Insurance began providing automobile insurance to Sears’ customers. In 1942, Sears opened its first store outside of the United States in Havana, in 1947 in Mexico and in 1952 in Canada. At the end of World War II, both Sears and Montgomery Ward each had sales of around $1 billion, but after the war, Sears’ sales grew to $3 billion in 1952 while Montgomery Wards sales remained around $1 billion. In part this was because Sears concentrated on the Sun Belt states where the population was growing. After the war, Sears also established stores in suburban malls where Sears became the anchor store for each new mall. By 1967, sales had increased to $1 billion per month. However, it was also in the 1960s that Sears began losing business to the lower-end retail companies. In 1962, Target, Walmart and K-Mart were all founded, three companies which would eventually replace Sears in the retail market, and one of which would buy out Sears. In the 1970s, high inflation pushed low-end consumers to discount retail stores like Target and Walmart, while higher end customers went to the more fashionable retail stores.
Sears, Super Stock
Shareholders who invested in Sears saw phenomenal returns as the chart below illustrates. The stock IPO’d at $50 in 1906, declined to $25 by January 1908 during the 1907 recession, then shot up to $200. Stock dividends followed in 1911, 1915, 1917 and in 1920. The stock split 4 for 1 in 1926 and 4 for 1 again in 1945. The cumulative value of stock splits, stock dividends and stock and rights distributions over the course of Sears’ history amounts to over 2000 to 1. Between 1908 and 1929, Sears stock increased in price 100-fold and with reinvested dividends, increased 215-fold, generating annual returns of 24.5% on the price and 29% on reinvested dividends. Between August 1906 when Sears had its IPO and December 1972, $1 invested in Sears stock grew to $928, an annual return of 11% and with reinvested dividends, shareholders would have turned $1 into $9915, an annual return of 15% over a period of 66 years. Sears provided one of the highest returns in the history of the American share market.The Sad but Steady Decline of Sears
In 1974, the 110-story Sears Tower, the tallest building in the world at the time, was completed just as Sears began its slow but steady decline. For the next 45 years, no matter what Sears did to try to stop its decline, it failed. Sears may have delayed the inevitable, but Sears had lost touch with the American market and Sears gradually but inevitably lost market share to companies above them and below them. Sears became a company of the past. The amount of changes Sears made to try and reverse its decline is impressive. Sears went into the finance business, acquiring the Metropolitan Savings and Loan Association, the broker Dean Witter, the real estate firm Caldwell Banker, and introduced the Discover Card in 1985, but none of these reversed the firm’s fortunes. In 1987, Sears introduced specialty superstores, in 1988, Sears acquired Eye Centers of America, Pinstripes Petites and Western Auto Supply. All to no avail. By the 1980s, K-Mart sales exceeded Sears’ sales. But the company could not change its core business and sales continued to decline and by 1991, Walmart’s sales exceeded those of Sears. In 1992, Sears slashed 47,000 jobs when it lost over $2 billion. The company introduced Canyon River Blues apparel, bought Lands End, purchased Orchard Supply Hardware, and introduced a Sears credit card. No matter what Sears did, it ultimately failed because it was Sears. It was a retailer of the past hemmed in by its product line. The company could not reinvent itself no matter how hard it tried. In 2003, Sears sold its financial and credit business to Citigroup, but by then Wal-Mart, Target and Home Depot all had greater sales than Sears. Sears was the retailer people used to go to, not the one they went to. Sears was no longer innovating and showing other retail stores how they needed to change. They were imitating the innovations of other companies, introducing financial products that others could provide better and were stuck with locations where growth was no longer occurring.Sears, Roebuck & Co. Becomes Sears Holding Corp.
Between 1972 and Sears’ buy out by K-Mart Holding Corp. in 2005, the stock only doubled in price as is illustrated above. In 2005, K-Mart acquired Sears, Roebuck and Co. for $11 billion after K-Mart completed its bankruptcy and re-emerged as K-Mart Holding Corp. Sears shareholders could choose to receive either $50 in cash or one-half share of Sears Holding Corp. Although the company made $1.5 billion in 2006, by 2010, Sears Holding Corp. was losing money and lost money every year after that. The Sears disease infected the renamed Sears Holding Corp. and the steady decline began as is illustrated below. K-Mart Holding Corp. stock had done well after it emerged from bankruptcy in 2003, rising from around $10 to $100 by the time the company acquired Sears, Roebuck and Co.The stock peaked in 2007 at around $195, but declined steadily after that. At $0.30 a share, the stock is back to the same level Sears, Roebuck & Co. was at in 1915, over 100 years of stock growth down the drain.
Amazon vs. Sears
The parallels between Sears and Amazon are instructive. While Sears had its catalog, Amazon has the internet. Both companies want to provide everything to everybody. Both companies rely heavily upon mail to ship millions of good from their distribution centers to millions of customers. Both companies rely upon low margins to build their business and drive out the competition. One hundred years ago, Sears drove the local general store out of business while Amazon is driving malls and retail stores (such as Sears) into bankruptcy. Both companies went from being a single-product company (watches for Sears and books for Amazon) into being a multi-product corporation that sells everything. Both companies didn’t want to just be the BEST retail option to its customers, but the ONLY retail option to its customers. Sears expanded into insurance with Allstate while Amazon has expanded into television through Prime and Amazon Web Services offering internet access through the cloud. Amazon shareholders have benefitted tremendously from the growth of the company. Between Amazon’s IPO on May 15, 1997 and the stock’s peak at $2050 in September 2018, Amazon stock increased 1000-fold generating an annual return of 39% over a period of 21 years. By contrast, between 1908 and 1929, Sears’ stock price rose 100-fold and 200-fold with reinvested dividends.
Amazon: The Sears of the Twenty-First Century
Sears successfully moved from the mail-order business to the retail business in the 1920s, and generating continuous growth until the 1970s. Amazon is now where Sears was in the 1920s. Amazon is opening up its own stores and has purchased Whole Food Markets to provide groceries to its customers. So far, Amazon has successfully followed in Sears’s footsteps and may do so for decades to come. But no company can grow at 40% per annum forever. At some point, Amazon’s growth will stall, and Amazon shareholders can only pray that the company has 50 years of growth ahead of it as Sears did in the 1920s. But if Amazon every builds a 100-story Amazon Tower, my advice would be to sell the stock.
 Although most dividends are paid in cash, companies are free to provide their shareholders with any type of dividend they want, including shares of stock or dividends in kind. Although the people on Wall Street often behave like they are a bunch of drunks, that doesn’t mean they are drinking, or that the companies they have ownership in are giving away free liquor, but we have found three cases where that did happen. Two of these, by National Distillers Product Corp. and Park and Tilford, have been covered in other blogs.
Whiskey Dividends
On October 15, 1933, shareholders of the National Distillers Product Corp. received a warehouse receipt for 24 pints of 16-year-old whiskey for every 5 shares of stock they owned. The whiskey had sat in a warehouse during Prohibition and with the 21st Amendment repealing Prohibition, the company celebrated by distributing their aged whiskey to shareholders. National Distillers stock rocketed up from 19 at the beginning of 1933 to 111.25 in September 1933 and shareholders not only got free whiskey, but benefited from the dramatic increase in the stock price as well. When the United States entered World War II, the government put a prohibition on the production of whiskey and similar liquors so the alcohol could be used for the production of ammunition and synthetic rubber which could no longer be imported from Japanese occupied Asia. In 1943, this prohibition was lifted and two companies rewarded their shareholders with whiskey they had been ageing in their warehouses. In December 1943, Park and Tilford announced that they were providing shareholders with the right to buy six cases of whiskey at a reduced price. Since the country was fighting World War II and all prices were regulated, the government stepped in to spoil the fun. The Office of Price Administration limited the negotiability of the whiskey purchase rights and the maximum profit on the resale of the liquor. Nevertheless, the price of Park and Tilford stock ran up from 57.625 in December 1943 to 98.25 on May 26, 1944. Park and Tilford took advantage of this increase in the price to sell shares to customers of Ira Haupt & Co. The brokerage unloaded such a large block of shares that the SEC treated the sale as a secondary offering and suspended Ira Haupt & Co.’s membership in the NASD for 20 days for not marketing the shares as such. The third company that distributed whiskey to their shareholders was the Tom Moore Distillery which provided shareholders with 27 original proof gallons of Kentucky bourbon whiskey for each share that they held.Whiskey for Tom Moore
Thomas Selvin Moore was born on March 18, 1853. His family emigrated from Ireland to begin a new life in Kentucky in the 1840s. Tom began working at John D. Willett’s distillery in 1874 and in 1876 Tom Moore and Ben Mattingly began operating Willett’s distillery on their own and changed its name to the Mattingly and Moore Distillery. The distillery was sold to outside investors in 1881, but Moore stayed on to help operate it. In 1899, Moore struck out on his own and purchased 116 acres of land outside of Bardstown at Morton’s Spring in Kentucky to build his own distillery. Initially, Moore was able to mash 100 bushels of wheat daily generating 10 barrels of whiskey. The distillery produced “Tom Moore” “Dan’l Boone” and “Silas Jones” whiskeys. By 1905, the distillery was mashing 300 bushels a day and the warehouses had a capacity of 20,000 barrels. A good wheat bourbon needs to age 12 years or more to reach the right flavor. In 1916, Moore repurchased the distillery he had worked at in Morton’s Spring to expand his production to meet the national demand for his whiskey.
Moore managed his distillery until 1919 when Prohibition was passed and Moore retired. When Prohibition was repealed in 1933, Moore’s son, Con joined with several partners to reopen and expand the distillery so it could age 50,000 barrels. The company continued to operate the distillery until 1944 when Barton Brands bought the company. The distillery was purchased by Sazerac in 2009, and the distillery was renamed the Barton 1792 Distillery. Tom Moore died in 1937 and in 2007, Tom Moore was voted into the Kentucky Bourbon Hall of Fame.
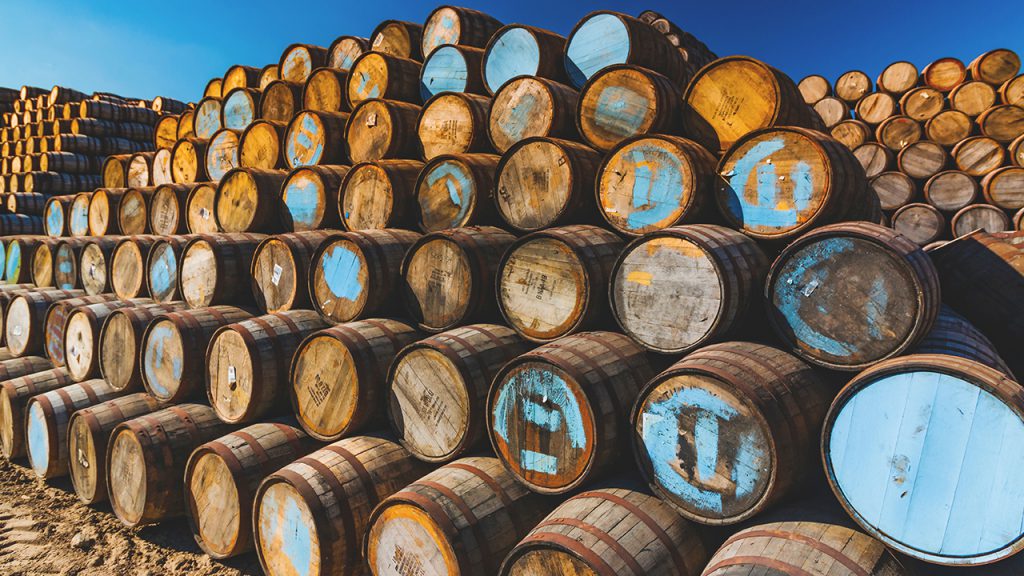
You can still visit the Barton 1792 Brewery in Bardstown, Kentucky, and after the two-hour tour, you can buy souvenirs and get your picture taken in front of the World’s Largest Bourbon Barrel which is over 15 feet tall. That would be enough bourbon to last me a lifetime!


Whiskey for the War
Few people today realize the impact World War II had on the production of whiskey. During the war, alcohol was needed to make ammunition but more importantly it was needed to make synthetic rubber. The source of natural rubber had been cut off by the Japanese expansion in the South Pacific. The distilleries went on war time Prohibition and were not allowed to make beverage alcohol. They had to produce high proof neutral spirits to produce these two main supplies for the war. Alcohol was used for many other necessary items such as anti-freeze, antiseptic and other medical needs as well. There was a brief lifting of the Prohibition in 1943 as stocks off alcohol reached a level that allowed for beverage production. Still there were changes made as barrel size was increased to 53 gallons and the hoops on the barrel were reduced in number from eight to six. This was done to save on wood and iron for the war effort. Glass was also saved as the bottle size of 4/5 quart became the recommended size instead of the quart. Grain was rationed to meet the needs of war production but there was no excess for beverage production as excess grain was needed to feed cattle to feed the troops. Consumers saw a shortage of spirits in the market. Aged products were often stretched by blending them with neutral spirits. Whiskey was available but straight whiskey was much more expensive.Whiskey for the Shareholders
On November 8, 1943, holders of Tom Moore Distillery Co. stock were issued dividend certificates for 27 original proof gallons of Kentucky bourbon whiskey. Originally, the distribution was scheduled for payment on December 1, 1943 to holders of record on November 26, 1943, but an injunction issued in the Detroit Circuit Court restrained the company temporarily from issuing the certificates. The record date was changed to December 16, and payment was made on December 21, 1943. The company issued dividend certificates which entitled stockholders to obtain barrels of whisky, equal to 53 gallons to the barrel, according to the number of shares they owned. A second certificate was issued for the gallonage not included in the warehouse receipts. Someone who owned 100 shares of stock received 2700 gallons of whiskey. This was equivalent about 51 barrels of whiskey. The certificates allowed holders to withdraw from the company’s bonded warehouse in accordance with federal and states laws and regulations. Of course, the government had to intervene, and the Office of Price Administration estimated that the 27 gallons of whiskey were valued at $31.59 or $1.17 per gallon. Those were the days! Someone who owned 100 shares of stock received whiskey the government valued at $3,159 and shareholders had to pay taxes on that amount. But this gave the shareholders something to complain out when they got drunk. Not only did shareholders receive a whiskey dividend, but the stock price responded as well. In December 1942, the company did a one-for-twenty-five reverse split reducing the number of outstanding shares from 500,000 to 20,000. This means that the company gave away 540,000 gallons, or about 10,000 barrels, of Kentucky bourbon whiskey to its shareholders.
 S&P Global and MSCI are making some major changes in the GICS sectors which will be enacted at the end of September. Under the old GICS, Telecommunications was one of the 11 GICS sectors which included primarily telephone companies. S&P Global and MSCI are changing the Telecommunications Sector to the Communications sector which includes not only Telecommunication Services, but Media and Entertainment stocks, which includes Advertising, Broadcasting, Cable & Satellite, Publishing, Movies and Entertainment, Interactive Home Entertainment and Interactive Media Services.
The most significant impact of these changes is that two companies that formerly were part of the Information Technology sector, Alphabet and Facebook, will be moved over to the Communications sector while Amazon has become part of the Consumer Discretionary sector since it is classified in the Internet & Direct Marketing Retail sub-industry. Although this leaves Apple and Microsoft in the Information Technology sector, this change has dramatically reduced the size of the Information Technology sector in the GICS. At the end of August 2018, the Information Technology sector represented 26% of the market cap of the S&P 500 while Telecommunications represented only 2%. These changes have turned the conservative, high-yielding Telecommunications sector into the high growth, low-yielding Communications sector. This reorganization of the GICS sector will balance out the two sectors by market cap more evenly.
This raises the questions, however, as to how the Media & Entertainment market cap of the new Communications sector has grown over time. Global Financial Data has data on the American stock market going back to 1791 and has classified all of the stocks traded on American exchanges over the past 225 years by GICS and sector. We have been able to calculate how the Media & Entertainment stocks have grown within the Communications sector over the past 150 years. The graph below illustrates these changes.
S&P Global and MSCI are making some major changes in the GICS sectors which will be enacted at the end of September. Under the old GICS, Telecommunications was one of the 11 GICS sectors which included primarily telephone companies. S&P Global and MSCI are changing the Telecommunications Sector to the Communications sector which includes not only Telecommunication Services, but Media and Entertainment stocks, which includes Advertising, Broadcasting, Cable & Satellite, Publishing, Movies and Entertainment, Interactive Home Entertainment and Interactive Media Services.
The most significant impact of these changes is that two companies that formerly were part of the Information Technology sector, Alphabet and Facebook, will be moved over to the Communications sector while Amazon has become part of the Consumer Discretionary sector since it is classified in the Internet & Direct Marketing Retail sub-industry. Although this leaves Apple and Microsoft in the Information Technology sector, this change has dramatically reduced the size of the Information Technology sector in the GICS. At the end of August 2018, the Information Technology sector represented 26% of the market cap of the S&P 500 while Telecommunications represented only 2%. These changes have turned the conservative, high-yielding Telecommunications sector into the high growth, low-yielding Communications sector. This reorganization of the GICS sector will balance out the two sectors by market cap more evenly.
This raises the questions, however, as to how the Media & Entertainment market cap of the new Communications sector has grown over time. Global Financial Data has data on the American stock market going back to 1791 and has classified all of the stocks traded on American exchanges over the past 225 years by GICS and sector. We have been able to calculate how the Media & Entertainment stocks have grown within the Communications sector over the past 150 years. The graph below illustrates these changes.


