Global Financial Data’s analysis of global markets gives a positive review for 2018.
Our review for 2017, “2017: Let the Bull Markets Continue,” hit the mark right on the spot. We noted that a “relatively large number of countries put in … a bear market bottom in 2016. Investors should expect that global markets will continue a bull market run in 2017.” And right we were.
Global Financial Data covers over 100 stock markets worldwide with over 100 years of data on bull and bear markets back to the 1800s. We keep track of the tops of bull markets and the bottoms of bear markets. A market top occurs when a peak is reached followed by a 20% decline. A market bottom occurs when a stock market hits a trough which is followed by a 50% or greater rise.
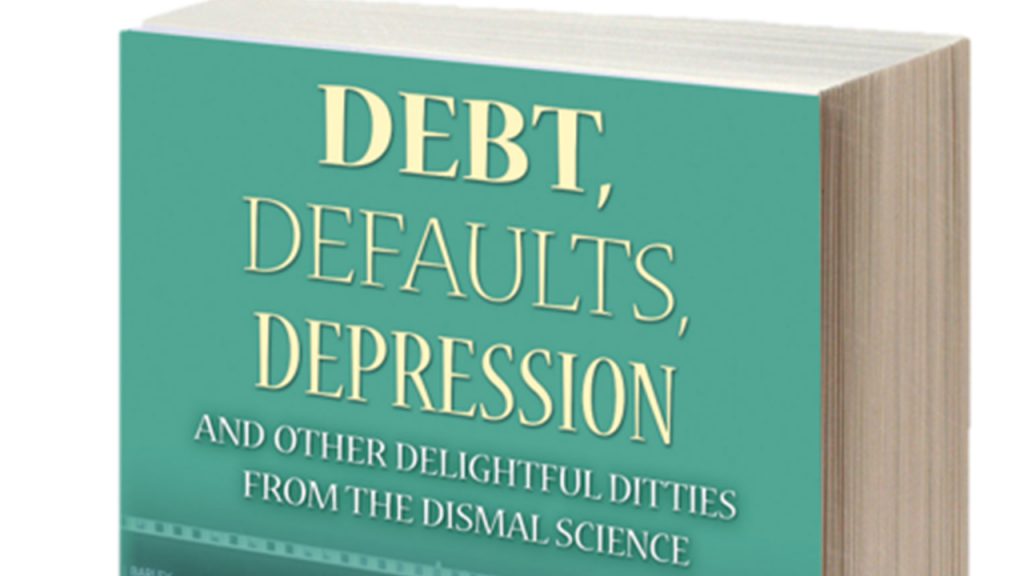
 Bryan Taylor, Chief Economist for Global Financial Data, has just released his first collection of articles and blogs on financial history. The book is a light-hearted look at some of the more entertaining episodes of economic history. There are 27 chapters covering a wide variety of topics. You can either read the book straight through or pick it up for a single chapter.
Bryan Taylor uses his knowledge of the past to illustrate how corporations and governments have helped and harmed the economy and financial markets. Readers will learn about the greatest counterfeiter of all time, the first publicly traded bonds, the worst inflation in history, the currency that created two countries, zombie bonds, and the New Jersey tailor who went to jail for undercutting other tailors by 5 cents.
Taylor provides his insights on the gold standard, government debt, the stock market and why the Fed will keep interest rates low for years to come. He discusses why the gold standard will never return and provides his own theory of the equity-risk premium and how it has changed over time. The author also gives his own personal experience of the Alice-in-Wonderland world of Cuban economics.
Whether looking for an amusing glimpse into the past or to learn how the economy can affect the stock market, Debt, Defaults, and Depression provides this and more. Even people who think calling economics the "dismal science" is being too kind will enjoy this book.
The book is available from Amazon as both an e-book for Kindle and as a paperback to be taken to the beach or on an airplane.
This book is the first of two collections of articles and blogs that Taylor has written. Taylor’s second collection of blogs, Stock Market Scams, Swindles and Successes will be released this summer.
 With the first round of French elections only one week away, it is important to remember that the results could have a profound effect on investors. Currently, four of the eleven candidates could move on to the second round on May 7 which will determine who will be the next President of France. The four main candidates are pro-market Fillon, nationalist Le Pen, socialist Mélanchon and centrist Macron. Europe and the rest of the world is eagerly awaiting the results because the winner could change not only France, but the rest of Europe for decades to come.
Don’t Forget the investors
Real Returns in USD in France and the United States, 1871-2016
| Country | Stocks | Bonds | Bills |
| France | 0.53 | -0.02 | -1.50 |
| United States | 6.37 | 2.22 | 0.60 |
Two Turning Points
To illustrate the impact that French elections and government policy have had on French investors, we can look at two events: the election of the socialist Léon Blum on May 3, 1936 and the “tournant de la rigueur” (austerity turn) instituted by François Mitterand in March 1983. Léon Blum led the Popular Front to victory in the French elections of 1936, which led to a series of leftist reforms that transformed the French economy. World War II began in 1939 and inflation reigned in France both during and after the war. The result was a disaster for French investors. Adjusting for inflation, 1 Franc invested on January 1, 1936 in French stocks, bonds and bills would have produced horrible losses over the next 15 years. After inflation, one franc invested in stocks in 1936 was worth 4.37 centimes in 1951, one franc invested in bonds was worth 3.88 centimes and one franc invested in bills was worth 3.26 centimes. In other words, no matter where you invested your money in France, you would have lost over 95% of your investment after inflation between 1936 and 1951. Although things improved after 1951 as France enjoyed its post-war growth, investors still received relatively lousy returns. In the 100 years before Mitterand introduced his austerity plan in 1983, French investors lost money no matter where they invested their funds. If investors had put 1 Franc in stocks, bonds and bills in 1882, 100 years later they would have been in tears. One franc invested in French stocks in 1882 left investors with 6.65 centimes after inflation 100 years later. If they had put their money in bonds, they would have ended up with 5.59 centimes and in bills 4.11 centimes after inflation. Over a 100-year period, French investors would have lost over 90% of their money after inflation no matter how they invested their money. Contrast this with the returns to American investors between 1882 and 1982. If American investors had put $1 in stocks in 1882, after inflation they would have ended up with $208 by 1982, $2.73 if $1 had been put in bonds and $1.18 if $1 had been put in bills. The graph below illustrates total returns to French investors in US Dollars after inflation.
When Mitterand was elected in 1981, he initially introduced left-wing economic policies which included nationalization, a higher minimum wage, a shortened work week and a 5-week vacation. The French economy went into a tailspin, and Mitterand’s reforms of March 1983 reversed these policies, attempting to control inflation through austerity and privatize portions of the French economy. For the first time in a century, French investors started to get decent returns.
Between 1982 and 2016, French investors received average annual returns of 8.31% for stocks, 6.86% for bonds and 2.61% for bills after inflation. Contrast this against annual real returns between 1882 and 1982 of -2.67% for French stocks, -2.84% for French bonds and -3.14% for French bills.
C’est incroyable!
Elections Matter
 Global Financial Data has added 320 Total Return Series to its GFD Indices. These series cover over 50 countries and include returns to stocks, bonds and bills. These indices use data already available in the total return series that are available through the GFDatabase. The indices are available both as nominal and inflation-adjusted series.These series differ from the GFDatabase indices because they have all been converted into United States Dollars and all have a common base of 12/31/1999 = 1000. This allows users to directly compare the returns to stocks bonds and bills from all major markets in the world. These total return series have more history than is available from any other vendor. A naming convention has been used to make access easier. Each series begins with “GFT” then add B for the Bond index, “C” for the Cash Index or “S” for the stock index, then add the ISO code for each country, then M for the nominal index and R for the Real Index. So the Hong Kong nominal stock exchange index is GFTSHKGM and the Canadian Real Bill Index is GFTCCANR.The GFD Total Return Indices complement the GFD Indices that are already available. The GFD Indices include several hundred series covering bonds, commodities, stocks and real estate. With the addition of these series, the GFD Indices include over 500 series. To get more information on these indices, call today to speak to one of our sales representatives at 877-DATA-999 or 949-542-4200.


