
Global Financial Data has collected extensive data on stocks from the United States and the United Kingdom covering over 400 years. With this, GFD plans to generate indices that cover the history of the stock market from the incorporation of the Dutch East India Company in 1602 to the current market in 2018. GFD will provide a general index, sector indices and size indices.
One question which the creation of size indices creates is how many components should be in the large cap, midcap and small cap indices. Where should large cap, midcap and small cap begin and end? Currently, each index company treats large cap, midcap and small cap indices differently. Let’s look at how different index companies treat market capitalization.
Large Cap, Midcap, Small Cap
Standard and Poor’s has three size indices for the United States with 500 shares in the large cap index, 400 in the midcap and 600 in the small cap. The 500-share index was introduced in 1957 and was meant to represent all of the actively-traded stocks on the New York Stock Exchange. Stocks on the American Stocks Exchange were mostly excluded. As the American market grew and shares began trading actively on NASDAQ, S&P saw a need for a new index. The 400-share Midcap was introduced in 1981, and the Small Cap Index was introduced in 1994. The proper weights for the three size indices was not calculated when the indices were introduced, so the S&P 500 Composite represents a disproportionate amount of the total market capitalization as is illustrated below.
| Index | Market Cap | Percent |
|---|---|---|
| Dow Jones Industrials | 7,105,746 | 23.82 |
| S&P 500 | 26,517,561 | 88.89 |
| S&P MidCap 400 | 1,935,311 | 6.49 |
| S&P SmallCap 600 | 939,132 | 3.15 |
| S&P SuperComposite 1,500 | 29,384,488 | 98.50 |
| US Total Market Cap | 29,832,836 |
The idea for a small cap index was introduced by Russell in 1987 and the data was extended back to 1978. Russell has 1000 stocks in their large cap index and 2000 in their small cap index. However, this creates an even greater imblance for the large cap stocks since the Russell 1000 represents about 92% of the total market cap in the United States and the Russell 2000 represents about 8%. Realizing that this allocation creates such a large imbalance Russell now calculates an index for the top 50 (39% of the market cap of the 3000), the top 200 (65% of the market cap) bottom 2500 (19% of the marke cap), and so forth.
Morningstar and MSCI have more balanced approaches to the size categories. Morningstar refers to the top 70% of stocks as large cap stocks, the next 20% as midcaps and the bottom 10% as small caps. MSCI divides the US stock market into 300 Large Cap stocks, 450 Midcap Stocks, 1750 Small Cap Stocks and the remaining stocks (around 1000) as Micro-cap stocks. By our calculations, this would give about 70% to the Large Cap 300, 16% to the Midcap 450, 13% to the Small Cap 1750 and 1% to the Micro-Cap 1000.
By contrast, the FTSE UK indices have 100 stocks in the Large cap Index, 250 stocks in the Midcap and the next 370 stocks in the Small Cap. By our calculations this gives about 79% of total stock market cap to the FTSE-100, 16% to the FTSE-250 and 5% to the remaining stocks.
Of all of these allocations, the Morningstar approach of 70% Large Cap, 20% Midcap and 10% Small Cap seems the most logical, but how do you put it into practice?
Taylor’s Golden Rule
When the S&P 500 was introduced in 1957, the 500 stocks represented over 90% of the stocks listed on the New York Stock Exchange, but by 2000 there were over 5000 stocks listed on the NYSE, AMEX and NASDAQ. In 2018 the number of stocks listed on the NYSE and NASDAQ had shrunk to around 3500. At the present rate of decline, in a few years there may not even be 3000 stocks to make up the Russell 3000.
The problem with creating long-term indices is that the number of stocks that listed on the exchanges and over-the-counter grew dramatically over time and the number of stocks in the large cap, midcap and small cap groups vary accordingly. During most of the 1800s, there weren’t even 500 stocks listed on all of the exchanges in the United States. So how do you determine how to allocate stocks to the large cap, midcap and small cap categories if the number of stocks in existence is constantly changing?
The best solution is to determine a ratio of the number of stocks in each category. Our research has shown that a golden rule possibly exists for the different groups by size. Our rule is the 10-20-30-40 rule. The top 10% of the stocks by number are Blue Chips, the next 20% are large caps, the next 30% are midcaps and the bottom 40% are small caps. A stock index that included 1000 stocks would include 100 Blue Chips, 200 Large Caps, 300 Midcaps and 400 Small Cap Stocks. The Blue Chips and Large Caps can be combined to create a single Large Cap group.
Allocations of the Sectors
To test our theory we calculated the market caps that would result from this combination for historical indices for the United States and the United Kingdom. For the United States, we chose 1000 stocks from 1894 to 2016, 500 stocks from 1875 to 1893 and 200 stocks from 1830 to 1874. For the United Kingdom we chose 250 stocks from 1864 to 1985.
After we summed the market cap for each group, we divided the market cap of each group by the market cap of all the stocks in the population to determine what the ratios of the different groups were. The results of our analysis are provided below. What is interesting is how closely the percentages for the Large cap, Midcap and Small cap compare over the 300 years of data that is used from the United States and the United Kingdom.
| United States | United Kingdom | ||||
|---|---|---|---|---|---|
| Average | St.Dev | Average | St.Dev | ||
| Blue Chips | 55.27 | 13.15 | 60.39 | 10.49 | |
| Large Cap | 22.67 | 5.29 | 18.85 | 5.01 | |
| BC + LC | 77.94 | 8.25 | 79.24 | 5.64 | |
| Mid Cap | 13.73 | 4.72 | 12.48 | 3.34 | |
| Small Cap | 8.35 | 3.57 | 8.28 | 2.35 | |
| PC of Total | 93.85 | 3.47 | 94.33 | 13.44 | |
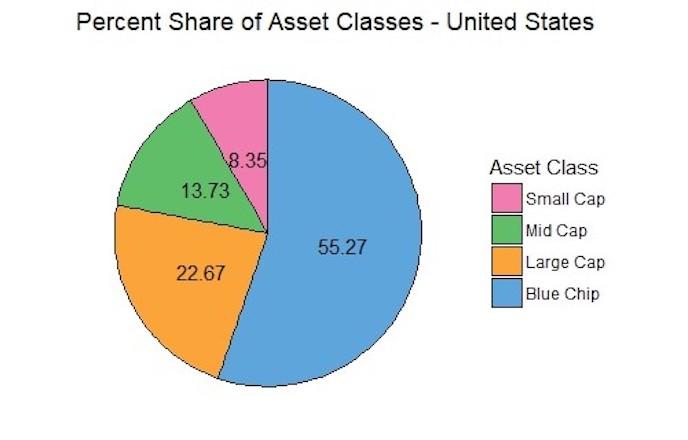
The result is five size indices which can provide useful information to investors. The Blue Chip stocks provide about 60% of the total market cap, the Large Caps 20%, the Midcaps 12% and the Small Caps 8%. As the number of stocks changes over time, or the number of stocks varies from one exchange to the other, these ratios can be used to create useful indices that provide contrasting behavior between the different size indices.
GFD’s size indices will be based upon Taylor’s Golden Rule, and we recommend that other index creators begin using this rule as well.

 On September 1, 2017 two of the giants of the chemical industry, Dow Chemical Corp. and E.I. du Pont de Nemours & Co. merged to form DowDuPont Inc. The new corporation is a holding company with divisions in agriculture, materials science and specialty products.
Both companies had been around for over 100 years before the merger occurred. E. I. du Pont de Nemours Powder Co. was founded in 1802 to manufacture explosives, and incorporated in New Jersey on May 19, 1903. E.I. du Pont de Nemours Co. incorporated in Delaware on September 4, 1915, succeeding E.I. du Pont de Nemours Powder Co. Dow Chemical Co. incorporated in Michigan on May 18, 1897. Although it is considered a “merger of equals”, Dow Chemical has become DowDuPont while E.I. du Pont de Nemours ceases to exist.
On September 1, 2017 two of the giants of the chemical industry, Dow Chemical Corp. and E.I. du Pont de Nemours & Co. merged to form DowDuPont Inc. The new corporation is a holding company with divisions in agriculture, materials science and specialty products.
Both companies had been around for over 100 years before the merger occurred. E. I. du Pont de Nemours Powder Co. was founded in 1802 to manufacture explosives, and incorporated in New Jersey on May 19, 1903. E.I. du Pont de Nemours Co. incorporated in Delaware on September 4, 1915, succeeding E.I. du Pont de Nemours Powder Co. Dow Chemical Co. incorporated in Michigan on May 18, 1897. Although it is considered a “merger of equals”, Dow Chemical has become DowDuPont while E.I. du Pont de Nemours ceases to exist.
As you can see, du Pont was the better performer from 1917 to 1932. The companies performed about the same between 1932 and 1966, but over the past 50 years, Dow Chemical has been the better performer, though considering the fact that this chart covers 100 years, their long-term performance has been remarkably similar.
Investors in DowDuPont in 2017 can only hope that the new company continues to outperform the stock market over the next 100 years.

 When Standard and Poor’s introduced the S&P 500 index in March 1957, it revolutionized the index world and created a benchmark for the stock market that is still used today. The original S&P 500 index included 425 industrial stocks, 15 rail stocks and 60 utility stocks. The S&P 500 maintained this composition until July 1976 when finance stocks were added to the index. The index included 400 industrials, 40 utilities, 40 finance and 20 transport stocks in 1976. Allocation by sector was abandoned on April 6, 1988 and today S&P uses their GICS sectors with no attempt to allocate stocks by sector.
When the S&P 90 Stock Index was introduced in 1928, it was the broadest cap-weighted daily index that was calculated in the United States and included 50 industrial stocks, 20 rail stocks and 20 utility stocks. Between 1928 and 1957, the number of industrial stocks grew dramatically. When Lew Schellbach introduced the S&P 500 on February 27, 1957, almost all of the expansion went to the industrial sector. The number of industrial stocks increased from 50 to 425 while the number of railroad and utility stocks hardly changed.
Advances in electronic calculation between 1928 and 1957 enabled Melpar Inc. to calculate a daily index of 500 stocks which could also be calculated on an hourly basis. More stocks could have been included in the index, but the other stocks were traded thinly or lacked sufficient public interest to be tracked on a daily or hourly basis. The 500 stocks that were put into the S&P 500 covered 90% of the stock market’s capitalization, and returns on the S&P 500 would differ little from a total market index that could have been calculated.
To provide some historical perspective, the data for the S&P Composite was extended before 1957 in two ways. First, daily data from the S&P 90 Index was used to provide a daily history back to 1928. Second, the Cowles Commission had calculated a composite extending back to 1871. Weekly data from Standard Statistics was used from 1918 to 1927 and the Cowles Commission data was used from 1871 to 1917.
What few people realize is that the composite index that Standard Statistics started calculating in 1918 was still being calculated in 1957 and the index included 480 stocks consisting of 420 industrials, 20 railroads and 40 utilities in 1957. So the new S&P 500 was little different from the existing S&P Composite. The difference was that in 1956, the broader S&P Composite was only calculated once a week on Wednesday, not daily. The S&P 90 was used to extend the S&P 500 back to 1928 because it was calculated on a daily basis, not because it was the broader index.
The existence of two Composite indices between 1928 and 1957 allows us to compare the performance of the two composites. Basically, the S&P 90 was a large cap index that included the 50 largest industrial stocks while the Composite included 350 industrials in the 1940s (402 stocks in total) and 420 industrials in the 1950s.
The chart below compares the performance of the two indices between 1928 and 1957. The data for the S&P 90 is included in the S&P Composite from 1928 to 1957 and the data for the broader composite is represented by the green line.
When Standard and Poor’s introduced the S&P 500 index in March 1957, it revolutionized the index world and created a benchmark for the stock market that is still used today. The original S&P 500 index included 425 industrial stocks, 15 rail stocks and 60 utility stocks. The S&P 500 maintained this composition until July 1976 when finance stocks were added to the index. The index included 400 industrials, 40 utilities, 40 finance and 20 transport stocks in 1976. Allocation by sector was abandoned on April 6, 1988 and today S&P uses their GICS sectors with no attempt to allocate stocks by sector.
When the S&P 90 Stock Index was introduced in 1928, it was the broadest cap-weighted daily index that was calculated in the United States and included 50 industrial stocks, 20 rail stocks and 20 utility stocks. Between 1928 and 1957, the number of industrial stocks grew dramatically. When Lew Schellbach introduced the S&P 500 on February 27, 1957, almost all of the expansion went to the industrial sector. The number of industrial stocks increased from 50 to 425 while the number of railroad and utility stocks hardly changed.
Advances in electronic calculation between 1928 and 1957 enabled Melpar Inc. to calculate a daily index of 500 stocks which could also be calculated on an hourly basis. More stocks could have been included in the index, but the other stocks were traded thinly or lacked sufficient public interest to be tracked on a daily or hourly basis. The 500 stocks that were put into the S&P 500 covered 90% of the stock market’s capitalization, and returns on the S&P 500 would differ little from a total market index that could have been calculated.
To provide some historical perspective, the data for the S&P Composite was extended before 1957 in two ways. First, daily data from the S&P 90 Index was used to provide a daily history back to 1928. Second, the Cowles Commission had calculated a composite extending back to 1871. Weekly data from Standard Statistics was used from 1918 to 1927 and the Cowles Commission data was used from 1871 to 1917.
What few people realize is that the composite index that Standard Statistics started calculating in 1918 was still being calculated in 1957 and the index included 480 stocks consisting of 420 industrials, 20 railroads and 40 utilities in 1957. So the new S&P 500 was little different from the existing S&P Composite. The difference was that in 1956, the broader S&P Composite was only calculated once a week on Wednesday, not daily. The S&P 90 was used to extend the S&P 500 back to 1928 because it was calculated on a daily basis, not because it was the broader index.
The existence of two Composite indices between 1928 and 1957 allows us to compare the performance of the two composites. Basically, the S&P 90 was a large cap index that included the 50 largest industrial stocks while the Composite included 350 industrials in the 1940s (402 stocks in total) and 420 industrials in the 1950s.
The chart below compares the performance of the two indices between 1928 and 1957. The data for the S&P 90 is included in the S&P Composite from 1928 to 1957 and the data for the broader composite is represented by the green line.

 Canada has an interesting stock market history because in addition to its stock exchanges in Montreal and Toronto, shares in Canadian companies also traded in London and New York. Canada was a British colony until 1867 when it gained its independence from the United Kingdom, and many Canadian securities were traded in London until World War I, though many of the securities listed in London were traded in Canadian Dollars, not British Pounds.
Trading in Montreal and Toronto
Brokers began trading shares at the Exchange Coffee House in Montreal in 1832 and the Montreal Stock Exchange was founded in 1874. The Toronto Stock Exchange was begun by the Association of Brokers in 1852, was formally founded in 1861 and incorporated in 1878. So, until the 1870s, Canada had no formal stock exchange. Until the 1930s, the Montreal Stock Exchange was the larger and more important of the two Canadian exchanges, but with the political problems of the 1960s and 1970s, including the adaptation of French as the official language in Quebec, more and more of the trading moved to Toronto. In the 1980s, Montreal became a derivative exchange and in 2008, the Montreal Exchange was formally acquired by the TSX Group. After World War I, Canadian companies listed on the New York Curb and shares in many of Canada’s largest companies were available on the Curb/American Stock Exchange. Until the 1930s, the Canadian Dollar and U.S. Dollar were linked at par to each other, but beginning in the 1930s, the currencies floated against one another and the prices in Montreal and Toronto differed from the prices in New York. Two Canadian companies, the Canadian Pacific Railroad and International Nickel were included in the Dow Jones Averages from the 1930s to the 1980s. There are many similarities and differences between Canadian stocks and U.S. Stocks. The market capitalization of the Canadian stock market has generally been about 10% of the size of the American Stock market. Canada has followed the American model more than the European model, and it avoided the military destruction of World War II and the wave of nationalizations that struck Europe after World War II. Canadian companies created to exploit the country’s mining and oil resources dominated the Canadian exchanges after World War II. Consequently, Canada’s market capitalization was the third largest in the world in 1950 after the U.S. and the U.K. The graph below shows how the distribution of sectors within the Canadian stock market changed over the past 200 years. As might be expected, banks have always played a prominent role in the economy. Canada has relied on a small number of national banks rather than thousands of state banks as in the United States. This is an important reason why Canada went through the 1930s without a single bank collapsing into bankruptcy while thousands of banks went under in the United States. Canada also has had a smaller number of companies dominating each sector and avoided the competitive battles that dominated industries in the United States. While American companies constantly sought growth through issuing new shares, acquiring other companies and growing through mergers and acquisitions, Canadian companies were more likely to rely upon reinvestment of capital than issuing new shares. In the graph below, the growth of transports in the1800s and its decline in the 1900s is visible, a pattern that occurred in all countries. The importance of energy and material stocks is the other defining feature of the stacked sector graph below. As in the United States, you can see the energy sector grow in the 1970s and 1980s when the price of oil went from $3 to $30, its demise in the 1990s and its resurgence after 2000 when the price of oil went exceeded $100. Material stocks grew in size in the 1930s after the price of gold and silver rose in price, then shrank back later. Canada Market Capitalization by Sector 1828 to 2018.
But which companies represented these changes in Canadian stocks? The history of the largest companies in the Canadian stock market is provided below.
The Governor and Company of Adventurers of England Trading into Hudson Bay
This was the official title of the first joint-stock company that was established in Canadian territory. The company was established in London on May 2, 1670 to collect furs from Canada and sell them in Europe. The company issued 105 shares of stock at £100 in 1670 giving the company a market cap of £10,500 or about $50,000. A flurry of trading in the 1690s drove the price of shares up to 260, but shares declined back to par at 100 by 1700. Unfortunately, there is no data on the price of Hudson Bay shares in the 1700s. The company recapitalized in 1821 and expanded the number of outstanding shares to 4,000. Shares traded at 160 in 1823 giving the company a market cap of $80,000. The price gradually rose to 268 in 1842 and in 1863, the company reorganized with 100,000 shares outstanding. The Hudson Bay Company remained the largest company in Canada until 1850, by which time its market cap had increased to $1.27 million. Unfortunately, we lack price data for the Hudson Bay Co. in the 1850s and 1860s, and although we know that the Hudson Bay Co. was the largest company in Canada in 1863 and 1864, whether it was larger than any of the other companies in Canada in the 1850s is difficult to discern.Banks and Railroads
Until 1825, there weren’t any other stock companies that operated in Canada. Then in 1825, the Canada Company was established to encourage emigration to Canada. However, it was the banks and railroads which eventually became the largest companies in Canada over the next eighty years. Until the coming of the transcontinental Canadian Pacific Railroad in 1883, the title of largest company in Canada would switch from one company to another. The leaders included the Bank of British North America (1852, 1860, 1861) which was incorporated in London in 1836 and established branches throughout “British North America” as Canada was known before it became an independent country in 1867. The Bank of British North America merged into the Bank of Montreal in 1918. The Great Western Railway of Canada stretched from Buffalo to Detroit and moved up into northern Ontario. This railroad was the largest company in Canada from 1853 to 1858 and in 1862, 1865-1869, 1871, 1872, 1879 and 1880. The railway was taken over by the Grand Trunk Railway of Canada in 1882. The Grand Trunk Railway was the largest company in Canada in 1859, but its stock price declined in 1860 and it was never the largest corporation in Canada in any other year. The Grand Trunk provided a Canadian route from Boston and New York to Chicago and had its headquarters in Montreal. A northern route of the railroad went from Montreal to the shores of Michigan. The railroad crossed over into Michigan and continued to Chicago. The Grand Trunk was asked by the Canadian government to build a railroad that crossed the continent to British Columbia, but the railroad refused and the Canadian government established the Canadian Pacific in 1881 to create a Canadian transcontinental railroad. The largest bank in Canada in the 1800s was the Bank of Montreal which held the crown of largest corporation in Canada in 1870, 1873, 1878, 1881 and 1882. Once the Canadian Pacific was established, however, the bank lost control of the crown. The Bank of Montreal was established in 1817 making it Canada’s oldest bank. Today, it operates as BMO Financial Group and although it is not the largest bank in Canada today, it is one of the largest, and is listed in both Toronto and on the New York Stock Exchange.The Canadian Pacific
When the Grand Trunk Railway refused to build a transcontinental railway to link eastern Canada with British Columbia on the Pacific Coast (the United States had completed its transcontinental railroad in 1869 when the Central Pacific and Union Pacific linked up in Utah), the government of Canada established the Canadian Pacific in 1881 to join eastern and western Canada together. The Canadian government had promised to extend a railroad to British Columbia when the province joined Canada in 1871. The transcontinental railroad reached British Columbia in 1885. The Canadian Pacific was the largest corporation in Canada from 1883 to 1928 and was listed simultaneously in Toronto, Montreal, New York and London. The railroad become so prominent that the Canadian Pacific was part of the Dow Jones Transportation Average from 1933 until 1988. The railway reorganized itself in 1996 and in 2001 and the third incarnation of the company still trades today. The railway was instrumental in settling the great plains between eastern Canada and British Columbia and making Canada the country it is today.Oil and Nickel
Two companies dominated the Canadian stock market from the 1930s to the 1970s, Imperial Oil Ltd. and Inco., Ltd. (then known as International Nickel). Although Imperial Oil still trades in Canada and on the New York Stock Exchange, Inco, Ltd. was acquired by the Companhia Vale de Rio Dulce in 2007. The Imperial Oil Co., Ltd. incorporated in Canada in 1880 and is an integrated oil company that produces, refines, distributes and sells oil throughout Canada. Imperial Oil was the largest company in Canada in 1929, 1931-1934, 1948-1954, 1956-1958, 1971-1975 and in 1982. Other Oil companies that claimed the crown were TransCanada Corp. in 1975 and 1977 to 1979, Gulf Canada in 1980 and Texaco Canada in 1981. Oil was an important part of the Canadian economy during the 20th Century and will continue to be in the 21st Century. International Nickel has control over the largest nickel reserves in the world. The company changed its name to Inco Ltd. in 1976 and it was the largest company in Canada from 1935 to 1947, in 1955, from 1959 to 1970 and in 1976. Although International Nickel was a Canadian company, it was part of the Dow Jones Industrial Average from 1933 to 1987.Telephones and Banks
Resources and transports dominated the Canadian stock market throughout most of the 20th Century, but the telecommunications revolution that transformed the world at the end of the 1900s also impacted Canada. Two of its telephone companies, Bell Telephone of Canada and Nortel Networks claimed the title of the largest company in Canada in the 1980s and 1990s. Bell Telephone of Canada, later known as BCE, Inc. was the largest company from 1983 to 1991 and in 1993 while Nortel Networks was the largest company in 1992 and from 1996 to 2001. The only break in the rule of the telephone companies was in 1994 and 1995 when Seagram was the largest company in Canada. During the 21st Century, finance firms have taken the lead position in Canada. The Royal Bank of Canada was the largest company in Canada in 2002, 2003, 2005 and from 2014 to 2017. Toronto Dominion was the largest company between 2006 and 2013, and Manulife Financial was the largest company in 2004. The domination of the Canadian stock market by banks is likely to continue since in 2017, the top three positions were held by banks with the Bank of Nova Scotia coming in at number three.Into the Twenty-First Century
The sectors and companies that dominate the Canadian economy over the next twenty years are likely to come from the finance and resource sectors. Banks will remain strong while oil stocks are likely to challenge the banks whenever the next oil boom or financial decline occurs. However, historically, banks have been much more conservative in their lending and trading than their American brethren to the south. You do not have a history of banks collapsing as a result of overlending or overtrading as happened in the United States. If a bank weakens, it is absorbed by another bank. Resources and banking are likely to be the drivers of the Canadian stock market in the century to come.| Year | Company | Market Cap |
|---|---|---|
| 1820 | Hudson's Bay Company | 0.8 |
| 1830 | Hudson's Bay Company | 1.37 |
| 1840 | Hudson's Bay Company | 1.68 |
| 1850 | Hudson's Bay Company | 1.27 |
| 1860 | Bank of British North America | 4.94 |
| 1870 | Bank of Montreal | 13.92 |
| 1880 | Great Western Railway of Canada | 21.91 |
| 1855 | Great Western Railway of Canada | 2.63 |
| 1890 | Canadian Pacific Railway Ltd. | 49.16 |
| 1900 | Canadian Pacific Railway Ltd. | 61.10 |
| 1910 | Canadian Pacific Railway Ltd. | 362.36 |
| 1920 | Canadian Pacific Railway Ltd. | 348.56 |
| 1930 | Canadian Pacific Railway Ltd. | 520.93 |
| 1940 | International Nickel (Inco, Ltd.) | 403.17 |
| 1950 | International Nickel (Inco, Ltd.) | 751.94 |
| 1960 | International Nickel (Inco, Ltd.) | 1712 |
| 1970 | International Nickel (Inco, Ltd.) | 3417 |
| 1980 | Gulf Canada Ltd. (British American Oil) | 5262 |
| 1990 | BCE Inc. (Bell Telephone of Canada) | 12073 |
| 2000 | Nortel Networks Corp. | 147300 |
| 2010 | Toronto-Dominion Bank | 129677 |
| 2017 | Royal Bank of Canada | 149717 |
