 Global Financial Data has put together several data series that enable us to track the capitalization of the world’s major stock markets from 1900 to 2018. With this data, we have calculated the global market capitalization of stock markets since 1900 and we have estimated values for Global GDP from 1900 to 2018. This enables us to calculate the total market cap of the worlds stock markets as a percentage of Global GDP and see how this has changed over the past 118 years.
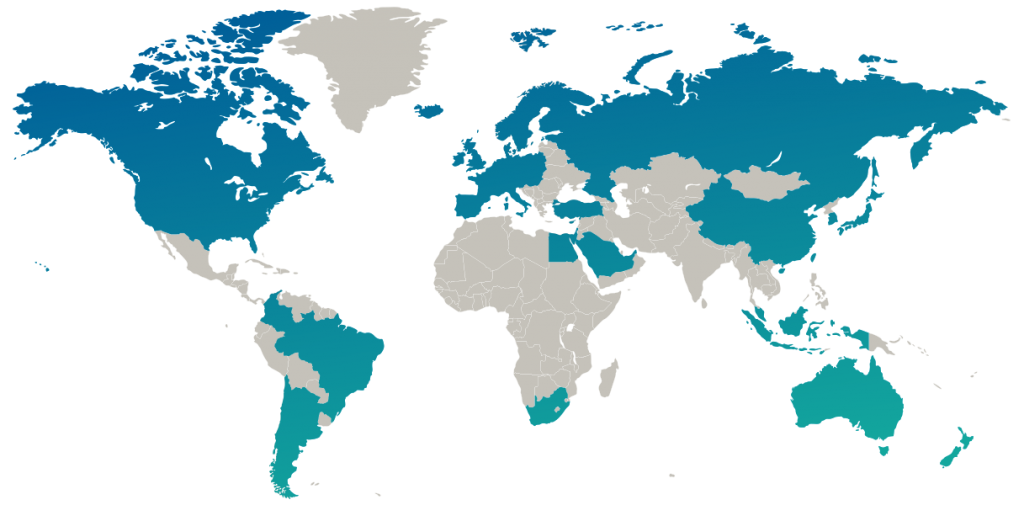
Market Cap and GDP Data Sources
For most of the twentieth century, the two largest stock markets in the world were New York and London. The United States calculations aren’t limited to the New York Stock Exchange, but includes the NASDAQ, American Stock Exchange/New York Curb, regional exchanges and over-the-counter shares. The London Stock Exchange also had extensive listings of shares from companies in South Africa, Australia, and other countries that GFD used to complete its calculations of total world market cap. Global Financial Data’s US and UK stock databases include all the stocks listed on these exchanges, and we have summed up the market cap of these companies to get an exact measure of the breadth of the stock market in the US and UK over the past 200 years. In addition to this, GFD has collected stock market capitalization data directly from Japan, Canada, France, Germany, Belgium, the Netherlands, Switzerland and other countries. Lyndon Moore published an article detailing the market cap of 12 major world markets between 1900 and 1925, and between these sources, GFD has been able to make an estimate of the total market capitalization of the world’s stock markets between 1900 and 2018 (see series SCWLDCM).
World Market Capitalization as a Percentage of World GDP, 1900 to 2018
Global Financial Data also has GDP data for every country in the world with many series extending back several centuries. We have summed this data to generate totals for world GDP going from 1900 to 2018 (see GDPWLD for nominal and GDPCWLD for real data). By dividing the world market cap estimates by world GDP we were able to generate the chart reproduced above. We can also use this data to generate a stacked chart showing how each country’s share of world market cap has evolved over the past 120 years. With the graph above, we can break up the history of global stock markets into several distinct periods: Pre-World War I growth, decline during World War I, the 1920s bull market, the 1930s depression, World War II and the post-war nationalizations, the Bull Market of the 1950s and 1960s, OPEC and inflation in the 1970s, European privatization and the Japanese stock market bubble in the 1980s, the rise of emerging markets and the dot-com bubble in the 1990s, the 2008 Financial Crisis and the recovery since then.70 Years of Financial Repression
Although few investors today may recognize it, the period from 1914 to 1986 was a period of financial repression by governments which actively intervened in financial markets and the economy and limited the growth of the stock markets both directly and indirectly. In July 1914, the world enjoyed a globalized economy in which the gold standard linked the currencies of the world and in which securities linked together the world’s primary exchanges. In the late 1800s, the world moved from a gold standard to a gold exchange standard. Under a gold standard, gold had to be literally shipped from one country to another to keep exchange rates in alignment with their gold parity rates, but under a gold exchange standard, individual securities could be bought and sold to bring currency rates back into alignment. In the mid-1800s, if there were a misalignment between the exchange rates of two countries, arbitrageurs would buy gold in one country and ship it to the other country to bring exchange rates back into alignment through supply and demand. By 1914, this was no longer necessary. Russian bonds, American railroad bonds, and the bonds of other countries were the international medium of exchange because these securities were traded on most exchanges in the world. If the exchange rate between the United States and Britain was out of line, securities could be bought in one country and sold in the other to realign the currencies. World War I and the intervention of governments that followed hindered the globalized securities market’s role of allocating funds between countries for the next 70 years. The exchange controls that were introduced in 1914 remained in place in one form or another for the next 70 years, limiting the ability of financial markets to move capital from one country to another. In addition to this, inflation after World War I, World War II and the OPEC crisis constrained the growth in financial markets because higher inflation rates mean higher discounts of future cash flows and thus a lower valuation of corporations. Governments nationalized many of the major sectors of the economy in Europe further reducing the capitalization of stock markets. It wasn’t until the privatizations of the 1980s and 1990s that the nationalized companies were returned to the private sector. Governments actively discouraged international cash flows and foreign investment through most of those 70 years, and instead of having an integrated global capital market, the world had a collection of stock markets divided by national borders. War was also a contributing factor to the reduction in the market cap of the world’s stock markets. World War I and World War II were total wars in which all of the nation’s resources were put to work to fight the war. National governments absorbed the available capital to fund their war effort as the National Debt/GDP ratio rose above 100% in many countries. After World War II, the experience of the Great Depression and World War II meant that economists used Keynesian ideology to justify their control of financial markets. Countries that went Communist completely eliminated stock markets. The tide in favor of capital markets turned in the 1980s when the Big Bang occurred in London and governments throughout the world privatized the industries they had nationalized. Ronald Reagan and Margaret Thatcher both believed in free markets, not government control. Their beliefs eventually began to influence the rest of the world. In Germany, Deutsche Telekom was one of the largest privatizations in European history, and in France, after flirting with socialism and government control of major industries, Mitterand reversed course and privatized France’s banks, utilities and other industries. The rise of computers enabled NASDAQ to challenge the NYSE, not only in obtaining new companies, but in creating listings for a whole sector of the economy that grew dramatically as new companies tried to provide access to investors to the information technology revolution. This ultimately culminated in the dot-com bubble of the late 1990s. By the 1980s, the transition to global security markets was so complete that James Carville said, “I used to think if there was reincarnation, I wanted to come back as the President or the Pope or a .400 baseball hitter. But now, I want to come back as the bond market. You can intimidate everybody.” By the 1990s, for the first time in history, the ratio of global stock market capitalization exceeded global GDP. As long as the financial repression of 1914 to 1986 does not return, the ratio of global stock market capitalization to GDP is like to remain around 100% for decades to come.Pre-World War I Growth
The world’s stock markets were truly global in 1914. All of the major nations of the world were on the gold standard and a country like Russia could issue stocks and bonds simultaneously in British Pounds, U.S. Dollars, German Marks, French Francs, Dutch Guilder and Russian Rubles in each of those countries. Russian bonds were then used to arbitrage any misalignment of currencies away from their gold parity. The London Stock Exchange was the home to companies from all over the world, and the Paris and Berlin stock exchanges hosted shares from many companies not listed in London. Between 1865 and 1914, the market cap/GDP ratio in the United States rose from 10% to over 50%. In the United Kingdom, the market cap/GDP ratio rose from 20% before the railroad bubble of the 1840s to over 140% by 1914. Similar growth was apparent in other economies as well. This change was driven by a reduction in the outstanding debt of the United States, United Kingdom and other countries in the 1800s, which freed up capital to invest in individual companies. By 1914, the United States had eliminated most of its debts from the Civil War, but even more dramatic was the reduction in the debt of the United Kingdom. The century between the end of the Napoleonic Wars in 1815 and the beginning of World War I in 1914 saw the UK government debt/GDP ratio drop from 230% in 1815 to 30% in 1914. All of that capital had been released to invest in the debt of American railroads, Russia and thousands of companies registered in London. Between 1914 and 1945, the UK government debt/GDP ratio returned to 230% of GDP and the British government not only redeemed many of the foreign securities that listed were in London, but restricted access to capital markets by both national and foreign investors.
British National Debt as a Percentage of GDP 1688 to 2017
In addition to this, the sectors of the companies on the stock market underwent a dramatic change. The 1800s was the century of the railroads, but the 1900s saw growth in dozens of industries outside transports. By 1893, Standard Oil was the largest company in the world, and over the next century, other industrial companies, such as AT&T, IBM, General Motors, General Electric, Apple and others would take the title of the world’s largest company. However, the numbers fail to show how the fabric of global capital markets were ripped apart when World War I began. Before 1914, there was minimal government intervention in capital markets and investors were free to move capital from one market to the other. After 1914, the government actively controlled capital flows for the next 70 years.World War I
Globalization stopped on July 31, 1914 when almost all the world’s stock exchanges closed because of the declaration of war in Europe. The world’s stock markets were at the mercy of national politics for the next 70 years. The St. Petersburg Stock Exchange was closed down in 1917, not to reopen until the 1990s. The United Kingdom needed to pay for the war it fought against Germany, and sold its American railroad stocks, put a halt to new IPOs and focused on issuing bonds to pay for the war, not to promote corporate growth. The German stock market was closed until 1917, and even in neutral countries such as the Netherlands, capital markets were regulated. The Vienna Stock Exchange broke up into stock markets in Vienna, Budapest, Prague and other former portions of the Austrian empire. Each country suffered high inflation during World War I, reducing the market cap relative to GDP, and the war was followed by the global recession of 1920 which further reduced stock market cap relative to GDP. The German stock market never recovered and between Germany’s hyperinflation and the chaos of Weimar, Germany’s stock market cap fell from $5.8 billion in 1914 to $680 million in 1923, declining from about half of GDP to less than 5%. By 1920, there was no global stock market, but a collection of national stock markets.1920s Bull Market
Although many European stock markets saw dramatic declines in their value after World War I, the United States, the United Kingdom, Canada and France enjoyed dramatic bull markets in 1920s. Although the economies of the axis powers failed to recover from World War I, growth returned to the allied economies. By 1929, the US, UK and Canada represented about 80% of global stock market capitalization even though those three countries represented about 38% of world GDP. The Russian stock market had disappeared, Germany had collapsed from its hyperinflation, and Austria was broken up. Most of the increase in the market cap in the 1920s came from the stock markets of the allies. This was especially true of the United States and Canada which had suffered no destruction from World War I and whose industries grew rapidly in the 1920s as millions bought new automobiles, radios and other consumer goods. This can be seen in the graph below which illustrates the percentage of global market capitalization for each country from 1900 to 2000.
National shares of Global Market Capitalization, 1900 to 2000
Depression and World War II
After 1929, the world’s stock markets collapsed. The Dow Jones Industrials lost almost 90% of its market cap. Smaller declines occurred in London and Montreal. France began nationalizing its industries under the Popular Front after 1936. Under Fascism, the state-controlled industry and the economy was directed toward rearming the country, not toward producing more consumer goods. National industries were favored and international trade was discouraged. The situation got even worse when World War II began. Private international capital flows ground to a halt. The government took over industry to fight the war and companies no longer raised fresh capital. World War II destroyed cities and factories and led to shortages in goods that had been plentiful a decade before. The end of World War II brought no relief. France and the United Kingdom nationalized their major industries. Two of the biggest UK companies of the 1800s, the Bank of England and the London and Northwestern Railroad became the property of the British government. Stock markets in eastern Europe were closed when the Communists gained power. The Frankfurt Stock Exchange reopened; the Berlin Stock Exchange did not. The French Stock Market’s capitalization as a share of GDP had been equal to 70% of GDP in 1914 and 1929, but by 1950 it was under 10% after the French nationalized its major industries. In the eyes of many, private capitalism had failed. Many believed that the experience of Russia and the war economy showed that the government could run the economy more effectively than the private sector and the ideas of Keynes were in the ascendant. Even an economist like Joseph Schumpeter wrote a book on the inevitable victory of socialism. Outside of the United States and Canada, many were ready to bury market capitalism forever.The Post-War Boom
1949 was the nadir of the anti-capitalism that dominated the world between 1914 and 1949. Bretton Woods laid a solid foundation for international exchange rates and the United States fought for open markets outside of the Communist bloc. Germany began its Wirtschaftswunder as its economy recovered, and Japan’s economy began its dramatic growth and recovery. Not only did the global economy grow rapidly between 1950 and 1970, but stock market capitalization recovered dramatically. World market cap grew from $163 billion in 1947 to $1.68 trillion in 1972, increasing over tenfold. The stock market’s share of global GDP grew from 25% to almost 50%. Nevertheless, in most European countries, the major industries of the economy remained under the control of the state. Although European economies allowed their currencies some freedom against the dollar after 1958, capital flows remained restricted. The world was still a collection of national stock markets, not an integrated global market as has existed in 1914. Governments still felt that they, not capital markets, knew best about how to manage the world’s economies.The Anglo-Saxon Four’s Dominance of Global Stock Markets
The United Kingdom and its three “offspring”, the United States, Canada and Australia, represented a growing portion of the total global market capitalization between 1900 and 1970. The United States, Canada and Australia suffered from neither the destruction of World War I and World War II nor the nationalizations that transferred transports, utilities, steel and other industries to the public sector. As the market cap of European countries’ stock markets shrank, the market cap of the UK, US, Canada and Australia grew relative to the rest of the world. The graph below shows the market cap of the UK, US, Canada and Australia as a percentage of global market cap from 1900 to 2017.
Market Cap of the UK, USA, Canada and Australia as a Percentage of World Market Cap, 1900 to 2017
In 1900, the world was balanced between the United Kingdom (33%), United States (30%) and the rest of the world (37%) and by 1914, the United Kingdom had shrunk (27%) while the United States’ share had grown (33%). However, by 1928, the United States’ share of global market cap had grown to 60% and the Anglo-Saxon Four represented 79.7% of world market capitalization. As the chart above shows, the Anglo-Saxon Four represented between 70% and 80% of global market cap in most years between 1920 and 1970. Nationalizations in the United Kingdom after World War II shrank it share of global market cap from 24% in 1945 to 12% in 1950, but Canada’s share grew from 3.4% in 1945 to over 10% by 1953, in part due to investments in mining and energy. This means that any indices of global stock markets during those 50 years will largely reflect the behavior of the four Anglo-Saxon stock markets. Since 1970, however, other countries’ stock markets have grown in size and even though the Anglo-Saxon 4 still represented about half of global market capitalization in 2017, this percentage is significantly below the 70%-80% level it was at between 1920 and 1970.OPEC and Inflation
Although it seemed as if global markets had returned for good, no one could have foreseen the problems of the 1970s. OPEC quadrupled the price of oil in 1973 and placed an embargo on countries that had helped Israel during the Yom Kippur war. OPEC raised the price of oil further over the next few years, and increased the price of West Texas Intermediate crude from $3.41 in 1973 to $39 in 1980. The economies of the western world shrank and during the inflation and the global recession of the 1970s the capitalization of stock markets fell back to around 25% of global GDP. The market cap/GDP ratio for the world shrank back to the lows it had been at in the late 1940s. The 1970s saw inflation hit its highest level outside of war in almost every country in the world. Although inflation increased the absolute level of market capitalization, it reduced it relative to GDP because high inflation reduced the discounted present value of future cash flows to corporations. In 1973, the fixed exchange rate system that had prevailed for the previous 25 years collapsed. Although the goal was to return to a system of fixed exchange rates once the OPEC crisis was over, the world has remained in a world of flexible exchange rates. Although restrictions on capital flows kept money from flowing freely between the world’s security markets, the move to a world of floating exchange rates made the eventual restoration of global capital flows inevitably.Privatization, Emerging Markets and Dot-coms
But just as the nadir of the late 1940s laid the foundations for a dramatic increase in the stock market, so did the nadir of 1981. Governments responded to the first OPEC price increase by introducing price controls and other restrictions on the economy which failed miserably. In the 1980s, Ronald Reagan, Margaret Thatcher and other world leaders favored market solutions over government regulations and the market boomed. Nippon Telegraph and Telephone was privatized in Japan and by 1989, it was the largest company in the world. Deutsche Telekom became the largest European privatization in 1995. Mitterand reversed course in the late 1980s and privatized not only the nation’s banks, but its utilities as well. Throughout the world, the government was privatizing the main industries of their economy both to promote economic growth and to raise capital for the state. The United States’ restrictions on interstate banking were lifted and thousands of banks merged to form multistate enterprises offering every type of financial service available. French stock market capitalization as a percentage of French GDP rocketed from under 10% in 1984 to 75% in 2001. In London, the Big Bang deregulated financial markets in London on October 27, 1986. If a single date could be selected when globalized financial markets returned to the world, this would be it. Under the big bang, fixed commission charges were abolished, the difference between stockjobbers and stockbrokers was eliminated and London moved from open outcry to electronic, screen-based trading. Driving all these changes was the relentless improvements in computer technology which gradually replaced trading floors. NASDAQ provided an example that the rest of the world followed, and during the 1990s, information technology grew to be one-third of the U.S. stock market as the dot-com bubble grew in size. In addition to this, the Asian Tigers of Hong Kong, Taiwan, Singapore and Korea used export-led growth to jump-start their economies. The Japanese economy grew rapidly until by 1989, its stock market capitalization was the largest in the world, briefly exceeding even that of the United States. This growth can be seen in the stacked chart above. Other emerging markets saw the success of the Asian tigers and began to emulate them. The Berlin Wall collapsed in 1989, the Soviet Union collapsed in 1991 and China began to open up to capitalism in the 1980s. The Shanghai and Shenzhen stock markets opened in 1990 and the St. Petersburg Stock Exchange reopened in the 1991. By the 1990s, almost every country in the world had eliminated barriers to capital flows. For the first time in 80 years, financial capital was free to flow between all the countries of the world. The debt of the United States was held throughout the world as trillions of dollars in government debt and stocks were traded on a regular basis. Today over 100 countries have stock exchanges where national securities can be traded.The Dot-com Bubble and Financial Crisis
In the United States, the dot-com boom propelled the NASDAQ to heights it had never seen before, and virtually any company that had .com in its name could IPO with billions of dollars in market cap overnight. By 2000, for the first time in history, the market cap of all of the world’s stock exchanges exceeded global GDP. The 1980s and 1990s saw the most dramatic growth in stock markets in history as the market cap/GDP ratio rose from 25% to 110%. However, the more open global markets led to financial crises because capital could easily flee countries that overborrowed. Eastern Asia suffered a financial crisis in 1997, Russia and Argentina in 1998 and the world when the dot-com bubble collapsed in 2000. Stock markets could not go up forever. The dot-com bubble collapsed in 2000 followed by the bankruptcies of Enron and Worldcom. Although increased capital flows meant that financial panics could quickly wipe out a large share of market cap, it also meant that markets could bounce back when optimism returned. Between 2002 and 2007, the market staged a remarkable recovery as the real estate boom replaced the dot-com boom. Once again, by 2008, total stock market capitalization exceeded GDP. When the dot-com bubble collapsed in 2000, world stock markets lost almost half of their market cap, but in 2008, stock markets worldwide lost over half of their market cap. In a matter of months, global stock market capitalization went from 110% to 50% of global GDP in the worst stock market collapse since 1929. Once again, the future of capitalism and stock markets was seemingly in question, but once again, as in 1949 and 1981, it was the perfect time to buy stocks. Central banks coordinated their intervention in financial markets, driving interest rates down to their lowest point in history. With interest rates close to zero, the discounted value of future cash flows rose pushing the stock market to new highs. Over the past ten years, stock have slowly climbed back and once again, global stock market capitalization exceeds global GDP.The Next Decade
Where will this chart go in the 2020s? Will stock markets continue to grow and stock market capitalization as a percentage of GDP stay above 100%, or are we headed for a triple top? The rise in stock market capitalization in the 1980s was driven by the privatization of public companies; the rise in the 1990s was driven by information technology; the rise before 2008 was driven by banks, real estate and greater liquidity; and the current rise has been driven by the central banks of the world pushing interest rates to zero. The world has changed dramatically since 1914. Before 1914, financial markets were left to their own devices and it was felt that governments should leave financial markets alone to allocate capital between the countries of the world. In the period between1914 and 1981, growth in the market cap/GDP ratio was constrained by war, inflation, nationalization, controls on international capital flows, and general financial repression by the governments of the world. In 2018, the central banks of the world have become the protectors of financial markets. Hundreds of millions of people have invested their pensions in the stock market and will be dependent upon them when they retire. A crash in the stock market will hurt the savings of hundreds of millions. Of the primary causes of financial repression during the period between 1914 and 1986, none of them, war, inflation, nationalization or controls on international capital flows look likely to reappear in the 2020s, so in the absence of financial repression, the global market cap/GDP ratio should stay around 100% or above. But then, in 1913, no one was predicting what happened in 1914. Global Financial Data has made major revisions to three of its popular indices, the Dow Jones Transport Average, the S&P 500 Composite and the S&P 500 Composite Total Return Index.
Global Financial Data has recently calculated its own GFD Index for Railroad stocks in the 1800s. Using data GFD has collected on the price of shares, dividends paid on shares and the number of shares outstanding, GFD has calculated a cap-weighted index of the price and total return to railroad shares from 1832 until 2018. In each year, Global Financial Data chose the top 40 companies by capitalization, then narrowed the list down to the top 25 companies by liquidity and used those 25 companies to calculate GFD’s Railroad Index. The index is illustrated below.
Global Financial Data has made major revisions to three of its popular indices, the Dow Jones Transport Average, the S&P 500 Composite and the S&P 500 Composite Total Return Index.
Global Financial Data has recently calculated its own GFD Index for Railroad stocks in the 1800s. Using data GFD has collected on the price of shares, dividends paid on shares and the number of shares outstanding, GFD has calculated a cap-weighted index of the price and total return to railroad shares from 1832 until 2018. In each year, Global Financial Data chose the top 40 companies by capitalization, then narrowed the list down to the top 25 companies by liquidity and used those 25 companies to calculate GFD’s Railroad Index. The index is illustrated below.

GFD Railroad Index, 1832 to 1899
We have appended the data for the GFD Railroad Index to the Dow Jones Transportation Average to provide a GFD Extension back to February 3, 1832. This provides the index with 57 additional years of daily history since the Dow Jones Railroad Index was introduced on September 23, 1889. For the S&P 500 Index, we had previously used data from Smith and Cole from 1834 to 1862 and from Macaulay from 1863 to 1870. Data from the Cowles Commission is used beginning in 1871. The data from Smith and Cole and from Macaulay were calculated as an equal-weighted index in the 1930s using a more limited number of securities. Also, their data were unable to use dividends to calculate total returns for their index. The GFD Indices are cap-weighted rather than equal-weighted and include dividends to calculate total returns. Consequently, the GFD Indices are superior to the Smith and Cole and Macaulay indices and will be used to extend the S&P 500 between 1834 and 1870. The Smith and Cole and Macaulay indices were equal-weighted while the GFD Indices are capitalization-weighted. As has been documented, equal-weighted indices tend to provide a higher return than capitalization-weighted indices because of the small-firm effect. That happened in this case. The equal-weighted data from Smith and Cole and Macaulay had an annual price return of 2.81% between 1834 and 1870 while the GFD Cap-weighted index had an annual return of 1.41% during the same period of time. We had previously assumed that the dividend yield on the railroad stocks was equal to the yield on U.S. government bonds plus 1%, implying a 1% equity risk premium. The average yield on U.S. government bonds between 1833 and 1870 was 4.53% per annum giving an assumed average yield of 5.53%. However, the actual dividend yield on railroad stocks during this period of time was 5.82% and the total return to railroad stocks was 7.32% per annum. The price return for the old index was 2.81% and the imputed dividend yield was 5.53% producing an overall total return to the old index of 8.05%. We feel that the new index data provides a more accurate measurement of the total return to stocks in the United States between 1834 and 1870. Therefore, we have replaced the old Smith and Cole and Macaulay data with GFD’s more accurate calculations. Global Financial Data is currently working on calculating indices for the banks, insurance companies and other corporations that were listed in the United States in the 1800s and hopes to add this data to the indices later this year. We encourage subscribers to download the corrected data. If you currently do not have access to this data, please feel free to call Global Financial Data today to speak to one of our sales representatives at 877-DATA-999 or 949-542-4200. The Amsterdam Stock Exchange is the oldest in the world. It was established in 1602 by the Vereenigde Oost-Indische Compagnie (Dutch East India Company) to aide in the trading of shares in the company. Amsterdam was the first exchange to begin trading securities and was the location of the tulipmania bubble of 1636 to 1637, the first bubble in financial history. Global Financial Data has collected data for three companies that traded on the Amsterdam Stock exchange in the 1600s and the 1700s, the Vereenigde Oost-Indische Compagnie (Dutch East India Company) which had a monopoly over trade in Asia, the Geoctroyeerde Westindische Compagnie (Dutch West India Company) which had a monopoly over trade in the Americas, and the Sociëteit von Berbice which established a colony in Guyana which ultimately failed.

Dutch East India Company, 1601 to 1794
Data for the East India Company (VOC1-AM) goes from 1601 to 1794 when the company fell into bankruptcy. Data for the West India Company (WIC1-AM) goes from 1628 to 1792 and data for the Society of Berbice (SBRB1-AM) goes from 1734 to 1752. Most of the data from the 1700s is bi-weekly or even daily during the 1720 bubble.

Dutch West India Company, 1628 to 1793
This data provides an insight into the behavior of stocks over a period of two centuries when the Dutch West India Company and the Dutch East India Company were one of the few stocks traded in the world. The Society of Berbice illustrates the performance of an attempt at colonization in the Americas that ultimately failed. Berbice included 12 plantations owned by the society, 93 private plantations along the Berbice River and 20 plantations along the Canje River. The colony suffered a severe blow in 1763 when 2,500 slaves rebelled and the leader of the rebellion, Coffy, temporarily become Governor of Berbice. The history of the Dutch East India Company and the Dutch West India are also imbedded in their stock price history. The rise of the companies in the 1600s, the impact of the Mississippi Bubble in France in 1719 and the South Sea Bubble in London in 1720 is clearly visible. The slow but steady decline in the price of the stock of the Dutch East India Company and the Dutch West India Company as each slowly slid into bankruptcy can also be traced. To better understand the history of the Dutch East India Company, read the blog, The First and the Greatest: The Rise and Fall of the Vereenigde Oost-Indische Compagnie

Society of Berbice, 1734-1752
To truly understand the performance of stocks over the past 400 years, these three companies cannot be ignored. The data is available to all subscribers to the Equity Microverse. If you would like access to this data, please feel free to call Global Financial Data today to speak to one of our sales representatives at 877-DATA-999 or 949-542-4200.
 Global Financial Data has calculated the market cap of the United States stock market from 1791 until 2018. These calculations include not only the New York Stock Exchange, American Stock Exchange and NASDAQ, but regional exchanges, such as Philadelphia and Boston and over-the-counter stocks, such as Standard Oil. We have divided the total market cap by GDP to examine how the stock market has grown relative to the economy over the past 200 years.
The graph below illustrates the results. There were two periods when there was a dramatic increase in the ratio of market capitalization to GDP over the past two hundred years. Both of these shifts occurred during communication revolutions which enabled the market to both build the infrastructure for these changes and enabled investors to have greater access to the stock market. In both cases, the communication revolutions that occurred encouraged globalization and the growth of the stock market.
Given this, we break down the growth of the stock market into four periods:
Global Financial Data has calculated the market cap of the United States stock market from 1791 until 2018. These calculations include not only the New York Stock Exchange, American Stock Exchange and NASDAQ, but regional exchanges, such as Philadelphia and Boston and over-the-counter stocks, such as Standard Oil. We have divided the total market cap by GDP to examine how the stock market has grown relative to the economy over the past 200 years.
The graph below illustrates the results. There were two periods when there was a dramatic increase in the ratio of market capitalization to GDP over the past two hundred years. Both of these shifts occurred during communication revolutions which enabled the market to both build the infrastructure for these changes and enabled investors to have greater access to the stock market. In both cases, the communication revolutions that occurred encouraged globalization and the growth of the stock market.
Given this, we break down the growth of the stock market into four periods:
- Antebellum America (1791-1865) in which the stock market grew with the economy and the market cap/GDP ratio stayed around 10%,
- Globalization (1865-1914) during which the United States raised capital from Europe to help build its economy and the market cap/GDP ratio rose from 10% to 50%. During this period of time the telegraph and telephone linked the world’s stock exchanges together creating a global market for shares,
- Regulation (1914-1980) during which the market cap/GDP ratio fluctuated around 50% as regulation, war, inflation and nationalization constrained the growth in the market cap/GDP ratio, and
- Deregulation (1980-2018) in which the market cap/GDP ratio grew to over 100% of the economy. The introduction of computers and the internet enabled traders to reduce the time a trade could take place from minutes to nanoseconds and enabled the stock exchange to move from a trading floor to computers
Data Sources
Global Financial Data has collected data on 50,000 securities that have traded in the United States over the past 225 years. GFD has data on the prices of stocks, the dividends and corporate actions, and the shares outstanding for each company. By multiplying the market price of each stock times the number of shares outstanding, we can calculate the market cap for each company, and by summing these numbers, we can calculate the total market capitalization for the United States. Our data set is limited to companies that operated in the United States. Companies that operated sugar plantations in Cuba before 1959, for example, are excluded as are American Depository Receipts (ADRs) and other foreign corporations. Although the number of foreign companies that listed in the United States was almost non-existent in the nineteenth century, the number grew rapidly during the twentieth century and today thousands of ADRs trade on U.S. exchanges. The market cap data we have collected only includes American companies. We took the calculations of GDP for the United States from the Bureau of Economic Analysis to determine how the ratio of market capitalization to GDP has changed over time. The result is provided in the graph below. A value of 100 means that the stock market capitalization was equal to 100% of GDP.
United States Market Capitalization as a Share of GDP, 1791 to 2018
Three major shifts in the ratio of market cap/GDP are readily apparent. The first occurred after the Civil War when international capital flowed into the United States to fund the growth of railroads, communications and other industries. The telegraph connected American cities in the 1840s and in 1866, a transatlantic cable linked New York to London and the rest of Europe. By the end of the century, the telephone began displacing the telegraph. The market cap/GDP ratio more than tripled from around 15% in the 1860s to 50% by the 1900s. During this period of time many industries amalgamated into Trusts that attempted to run their industry as a monopoly. Antitrust laws and other regulations put an end to these shifts. When World War I began, regulation, inflation and war kept the market cap/GDP ratio from growing. Between 1915 and 1980, the ratio fluctuated up and down, hitting a high during the bull market of the 1920s and the economic growth of the 1950s and 1960s, and reaching low points after World War I and World War II. There are several reasons why regulation, inflation and war limit growth in the market cap/GDP ratio. Government regulations can restrict corporations from growing in size or limit corporations’ ability to issue new capital. Higher rates of inflation discount the present value of future corporate cash flows. The bouts of inflation in the United States that occurred after World War I, World War II and the Vietnam War clearly drove the market cap/GDP ratio down. War affects the ratio both indirectly through higher inflation and directly because resources are reallocated from funding the growth of new companies to funding the war. New issues of securities are discouraged by the government so resources can be reallocated to pay for the war. During the 1980s, a third shift in the market cap/GDP ratio occurred when the ratio more than doubled, increasing from around 50% in the early 1980s to over 100% by the end of the 1990s. The introduction of computers and the internet made the old trading floor obsolete. Traders could place their orders online and the orders were filled in nanoseconds. The Reagan administration deregulated the economy and shifted the regulatory burden of proof on the government, not on corporations. With the exception of the financial crisis of 2008, the market cap/GDP ratio has stayed above 100% during the past 20 years. We argue that as a result of this second communications revolution, the increase in the market cap/GDP ratio over 100% is a permanent shift that will probably keep the ratio above 100% for the rest of the century.Antebellum America
It is surprising that the market cap of United States stayed around 10% consistently from 1791 until the 1860s despite the rapid changes in the American economy. However, it is important to differentiate between growth in the American economy and changes in the capitalization of corporations in the United States. Although the market cap of the stock market grew in line with the economy before the civil war, its growth did not exceed that of the economy until after the Civil War. When the Bank of the United States was capitalized at $10 million in 1791, the GDP of the United States was only $200 million and the market cap of the three banks and one industrial firm that were listed totaled $17 million. Initially, virtually all the companies that listed in New York, Philadelphia, Boston or other exchanges were in insurance or banking, but gradually other industries appeared. Transport stocks started trading in 1801. First there were turnpikes, most of which were too small to trade on the exchanges, then there were canals which did trade on exchanges and in the 1830s, railroads made their appearance. Railroads dominated the stock market of the United States throughout the 1800s. Utilities started trading in 1804, and in the 1830s, hundreds of mills were established in Massachusetts producing textiles and clothing for the country. The mills traded primarily on the Boston stock exchange, and by the 1840s, these mills represented over 10% of U.S. stock market capitalization. Over the next couple decades, energy companies started producing coal, industrial manufacturers appeared, mining companies started mining for copper, silver and gold, and the first real estate companies issued shares. Despite all of these changes, the stock market could barely keep up with the growing American economy. Between 1791 and 1861, the market cap of the United States grew twentyfold, from $17 million to $345 million, but America’s GDP grew at a similar pace, increasing from $200 million to $4 billion. Then the Civil War changed the American economy forever.The Gilded Age and Globalization
Once the Civil War was over, the pace of growth in the United States and the stock market quickened dramatically. Between 1865 and 1901, the American economy grew from $6 billion to $20 billion, but the market cap of companies listed in the United States grew from $635 million to over $10 billion. The ratio of stock market cap to GDP grew from 10% to over 50% as hundreds of companies raised capital by issuing shares. Once the war was over, the robber barons of the gilded age built the railroads, steel and other industries that built America. The telegraph enabled traders in different American cities to connect directly with brokers at the stock exchange, and the telephone enabled investors to speak directly to brokers in New York. By 1866, a transatlantic cable had been laid, linking the American and European continents. By the end of the century, a global system of telecommunications connected all the stock exchanges of the world together, laying the foundations for the globalization of international finance. Not only did this communications revolution enable investors to buy and sell stocks more, but corporations had to raise the capital to fund the growth in America’s infrastructure. This combination of factors pushed the market capitalization of companies listed on the stock exchanges to half of GDP by the end of the century. The period from 1865 to 1914 was the height of globalization. Railroads in the United States took advantage of this and marketed their stocks and bonds in London, Amsterdam, Paris, Berlin and other European stock exchanges. The United States raised huge amounts of capital and in the process became a net debtor to the rest of the world, but in the process, it was able to build the infrastructure for the American economy. Railroads raised over one-third of their capital in Europe. As was true in antebellum America, the American economy underwent rapid changes after the Civil War. The chart below illustrates how the sectoral composition of the American stock market changed over the past 200 years. Although the largest share of market capitalization in the 1800s was concentrated in the railroads, their share shrank between 1865 and 1914, Other sectors, especially energy and industrials grew even more dramatically than railroads with Standard Oil, AT&T and U.S. Steel becoming some of the biggest companies in the world.
Sectoral Allocations in the United States, 1800 to 2018
Between 1865 and 1901 railroads shrank from 58% of the total market cap to 40%, finance shrank slightly from 23% to 19%, but the real growth was in materials and energy. In 1865 the Illinois Central Railroad was the largest company in the United States, but in 1901 Standard Oil was over twice the size of the next largest company, Penn Central. The third largest sector by market cap in 1865 was consumer discretionary, primarily made up of the mills in New England, but in 1901, communications, consumer staples, energy, industrials, materials and utilities were all larger than consumer discretionary. In 1901, energy was the third largest sector in the United States, having grown from 2% in 1865 to 10% by 1901. Even more impressive was the growth in Communications. There were no communications companies listed in the United States in 1861, but between the telegraph and telephone, communications grew to almost 6% of the total market cap in the United States by 1901. The leaders of industry in the last third of the 1800s played an essential role in converting corporations into capital that could be owned by investors. By the end of the nineteenth century, the Gilded Age was over and the era of trusts in which industries amalgamated to create single companies that oversaw the production of oil, cigarettes, sugar and other goods dominated the economy. Without the conversion of companies into shares that could be bought and sold, the conversion of the economy into a collection of industrial trusts would not have been possible.Government Regulation
Globalization came to an end on July 31, 1914 when the world’s stock exchanges closed down at the beginning of World War I. The U.S., U.K. and French stock markets reopened by the end of 1914, but the German and Russian stock markets didn’t reopen until 1917. When the October Revolution began in Russia, the St. Petersburg bourse closed for the next 75 years. The period between 1914 and 1980 was one of financial repression in which government regulation of financial markets and the economy prevented the stock market from increasing its share of GDP. There were periods such as the 1920s, 1950s and 1960s in which financial markets operated relatively freely and grew, but there were also periods of regulation (1930s), inflation (1920s and 1970s) and war (1910s, 1940s, 1970s) during which market cap’s share of GDP declined. When the United States entered World War I, capital shifted from investing in new companies to funding the war, and the flow of capital from Europe to America came to an abrupt halt. After the war, one of the primary enemies of investors raised its head: inflation. Although inflation has never wiped out American investors as it did in Germany during the 1920s, inflation has reduced the return to investors and shrank the market cap/GDP ratio in the 1920s, 1940s and 1970s. Inflation is the greatest enemy of investors. Higher inflation leads to higher interest rates which reduces the price of bonds. High inflation also means lower stock prices. The value of a company depends upon the discounted value of future cash flows. As inflation rises, interest rates increase and the discounted value of future cash flows declines causing stock prices to decrease. When inflation increases, as it did after World War I and in the 1970s, the market cap/GDP ratio declines. Whenever, disinflation occurs, as it did in the 1920s and after 1981, the market cap/GDP ratio rises. The 1920s, of course, led to a bull market that is still remembered, and by the summer of 1929, for the first time in its history, the market cap of all stocks listed in the United States exceeded national GDP. In September 1929, the market cap of stocks listed in the United States reached $125 billion while nominal GDP was at $106 billion. Although GDP fell to $60 billion by 1932, the stock market cap fell to $25 billion. Market cap did not exceed GDP again until the 1990s when a new communications revolution, the dotcom bubble, deregulation and disinflation drove this ratio to the highest level it has ever been. Once the United States entered World War II in 1939, capital was directed toward the war effort and the market cap/GDP ratio fell to 23% during the war. Even as late as 1948 the market Cap/GDP ratio was under 25%, but in 1948 as the cold war broke out, and the United States focused on growing the economy once again, the ratio began to rise. Growth in the stock market affected all the sectors in the economy. In 1968, the market cap/GDP ratio reached 87%, the highest it had been since 1929. The Nifty Fifty became the benchmark for the stock market and just as it looked like the market cap would exceed GDP, OPEC upended the market. The price of oil went from $3 in 1972 to $39 by 1982 and stagflation became the dominant theme of the economy. Interest rates had been slowly rising since the 1940s until they reached double digits in 1982. Since the value of companies depends upon the discounted value of future cash flows, stock prices were hit badly, and the market cap/GDP ratio fell from 87% in 1968 to 37% in 1974. As in most cases in stock market history, when things looked the darkest, it was the best point to invest.Deregulation
Ronald Reagan was elected president in 1980 and he deregulated the economy to promote economic growth. At the same time, Paul Volcker fought inflation and initiated the beginning of a 35-year decline in interest rates. Moreover, technology in the form of computers, the internet and biotechs began to dominate the stock market as a new communications revolution began. The yield on the 10-year bond fell from over 15% to under 5% between 1981 and 1999. The market cap/GDP ratio rose from 38% in 1981 to 163% in 1999 more than quadrupling the ratio. All the stars were aligned to move capital into the stock market. Once again, a communications revolution broke over the stock market. Computers enabled trading times to shrink from minutes to nanoseconds. The internet enabled investors to place trades directly with the stock exchange without having to use a human broker. Information technology and communication stocks grew in size rapidly and contributed to the growth in the size of the market. It was in large part because of this communications revolution that the financial world became globalized once again. Deregulation became a world-wide phenomenon. Margaret Thatcher and Ronald Reagan promoted the growth of the economy through deregulation. The Big Bang opened up financial markets in London. The Berlin Wall and the Soviet Union fell. The four Asian tigers (Japan, Taiwan, Korea and Singapore) were able to achieve rapid growth through exports and both China and Russia opened up stock markets in formerly communist countries. The global market cap/GDP ratio rose from around 25% in 1980 to over 100% by 2000, mirroring the trend in the United States as is illustrated below.
