25 years ago: September 1994
S&P 500: 462.69 (vs. 3006.79 in 09/2019) 10-year U.S. Government Bond Yield: 7.62% (vs. 1.79% in 09/2019) Gold: $394.85 (vs. $1500.70 in 09/2019) Oil: $18.355 (vs. $58.19 in 09/2019) GBP/USD: 1.5775 (vs. 1.2524 in 09/2019) US GDP: $7,331 billion (vs. $21,338 billion in 06/2019) US Population: 260 million (vs. 328 million in 2019) 09/01/1994: The largest product-liability settlement ever, a $4.2 billion agreement between women and the manufacturers of silicone breast implants, is approved. 09/03/1994: Sino-Soviet split: Russia and the People's Republic of China agree to de-target their nuclear weapons against each other. 09/08/1994: USAir Flight 427, on approach to Pittsburgh International Airport, suddenly crashes in clear weather killing all 132 aboard; resulting in the most extensive aviation investigation in world history and altering manufacturing practices in the industry. 09/13/1994: An interstate-banking bill wins final congressional approval. 09/14/1994: The Major League Baseball season is canceled because of a strike. 09/27/1994: A money-market fund shuts down after its net asset value falls below $1 a share, hurt by derivative investments. The GOP signs a Contract with America promising large-scale reforms. 09/28/1994: The cruise ferry MS Estonia sinks in the Baltic Sea, killing 852 people.50 years ago: September 1969
S&P 500: 93.12 (vs. 3006.79 in 09/2019) 10-year U.S. Government Bond Yield: 7.51% (vs. 1.79% in 09/2019) Gold: $40.675 (vs. $1500.70 in 09/2019) Oil: $3.21 (vs. $58.19 in 09/2019) GBP/USD: 2.3826 (vs. 1.2524 in 09/2019) US GDP: $1,030 billion (vs. $21,338 billion in 06/2019) US Population: 205 million (vs. 328 million in 2019) 09/01/1969: Muammar Gaddafi (Military/Arab Socialist Union) became Chairman of Libya 09/02/1969: AFL-CIO President George Meany said only wage-price controls can halt inflationary spiral. 09/03/1969: Ho Chi Minh died. Concern about Ho's death caused heavy selling. Power failure halted trading temporarily on the New York Stock Exchange. 09/05/1969: My Lai Massacre: U.S. Army Lieutenant William Calley is charged with six specifications of premeditated murder for the death of 109Vietnamese civilians in My Lai. 09/09/1969: In Canada, the Official Languages Act comes into force, making French equal to English throughout the Federal government. 09/15/1969: Possibility of more troop removals from Vietnam helped market rally. 09/26/1969: Abbey Road, the last recorded album by The Beatles, is released.100 years ago: September 1919
S&P 500: 8.941 (vs. 3006.79 in 09/2019) 10-year U.S. Government Bond Yield: 4.73% (vs. 1.79% in 09/2019) Gold: $20.67 (vs. $1500.70 in 09/2019) Oil: $4.25 (vs. $58.19 in 09/2019) GBP/USD: 4.18 (vs. 1.2524 in 09/2019) US GDP: $84 billion (vs. $21,338 billion in 06/2019) US Population: 104 million (vs. 328 million in 2019) 09/09/1919: Boston Police strike. 09/10/1919: The Treaty of Saint-Germain with republic of Austria. It confirms the break of Austria-Hungary. Its territory comes down to newly formed countries Austria, Hungary, Czechoslovakia, Poland, Romania, and the Kingdom of Serbs, Croats and Slovenes. South Tyrol with its German population and Trentino fall to Italy. 09/11/1919: U.S. Marines invade Honduras. 09/18/1919: Fritz Pollard becomes the first African-American to play professional football for a major team, the Akron Pros. The Netherlands gives women theright to vote. 09/22/1919: Major steel strike began that lasted until January 20, 1920. The steel strike of 1919, led by the Amalgamated Association of Iron and Steel Workers, begins in Pennsylvania before spreading across the United States. 09/28/1919: Race riots begin in Omaha, Nebraska.200 years ago: September 1819
S&P 500: 1.5876 (vs. 3006.79in 09/2019) 10-year U.S. Government Bond Yield: 4.615% (vs. 1.79% in 09/2019) Gold: $19.39 (vs. $1500.70 in 09/2019) GBP/USD: 4.5065 (vs. 1.2524 in 09/2019) US GDP: $727 million (vs. $21,338 billion in 06/2019) US Population: 9.379 million (vs. 328 million in 2019) 09/12/1819: Joaquin Jose Melgarejo y Saurin became Prime Minister of Spain 09/25/1819: Rev Marsden plants 100 vines, the first grapes grown in New Zealand.
Global financial Data has calculated an index for Emerging Markets that far precedes any indices that are currently available. MSCI’s emerging market index begins in 1987. GFD’s Emerging Market Index begins in 1602. Though few people may realize it, emerging markets are one of the primary reasons why stock markets came into existence 400 years ago.

This is the third in a series of blogs we are writing about global bear markets that have occurred over the past 400 years. Global Financial Data has calculated a World Stock Index that covers equities from 1602 until the present. The index included only one company in the 1600s, a handful of international trading companies in the 1700s, ten stock markets in the 1800s and all developed markets in the 1900s. Today there are over 100 stock markets throughout the world with about 25 developed markets, 25 emerging markets and 50 frontier markets.
The 1700s was a century of war during which there were five bear markets, each driven directly or indirectly by a European war. The 1800s, on the other hand, was a century of peace, with numerous panics, but only one global bear market which occurred in the 1840s. There were no global bear markets between 1848 and 1912, a 64-year stretch of peace and economic growth.
War hit the world in 1914 when World War I began. Four bear markets occurred between 1912 and 1949. With the world generally at peace after World War II, recessions, sometimes driven by financial panics, were the main cause of bear markets. This certainly was the case of the two bear markets that have occurred in the twenty-first century. Over time, bear markets have become more frequent, more integrated, but shorter in duration. Information on the global bear markets since 1900 is provided in Table 1 using data from the GFD World Index.
| Begins | Index | Percent Up | Ends | Index | Percent Down | Cause |
| 8/31/1912 | 47.07 | 126.28 | 7/31/1921 | 28.51 | -39.44 | World War I |
| 8/31/1929 | 86.61 | 203.83 | 6/30/1932 | 21.29 | -75.42 | Great Depression |
| 2/28/1937 | 63.34 | 197.55 | 5/31/1940 | 38.16 | -39.75 | World War II Begins |
| 5/31/1946 | 69.34 | 81.71 | 9/30/1949 | 51.03 | -26.41 | Post-World War II |
| 01/31/1969 | 308.02 | 502.38 | 6/30/1970 | 229.81 | -25.39 | Vietnam War |
| 3/31/1973 | 406.01 | 76.67 | 9/30/1974 | 233.89 | -42.39 | OPEC I |
| 11/30/1980 | 547.70 | 134.17 | 6/30/1982 | 412.86 | -24.62 | OPEC II |
| 8/31/1987 | 1590.67 | 580.09 | 11/30/1987 | 1241.35 | -21.96 | 1987 Crash |
| 12/31/1989 | 1808.75 | 45.71 | 9/30/1990 | 1369.40 | -24.29 | Iraq War |
| 3/31/2000 | 4983.63 | 263.91 | 9/30/2002 | 2508.42 | -49.66 | Internet Bubble |
| 10/31/2007 | 5775.75 | 130.25 | 2/28/2009 | 2612.11 | -54.77 | Financial Crisis |
Table 1. Global Bear Markets since 1900
The correlation of bear markets between the World Index and the World excluding the United States Index is strong, but some important differences occur. The post-World War II bear market outside of the United States began in July 1944 rather than May 1946. The 1968-1970 bear market did not occur outside of the United States, and the 1989 bear market lasted until April 1992 outside of the United States rather than ending in September 1990.
Figure 1 compares the behavior of the S&P 500 and GFD’s World Stock Index. There is a very high correlation between the two indices with the correlation increasing over time. The relationship after World War II is much stronger than it was before World War I primarily because the United States’ share of global market capitalization increased over time.
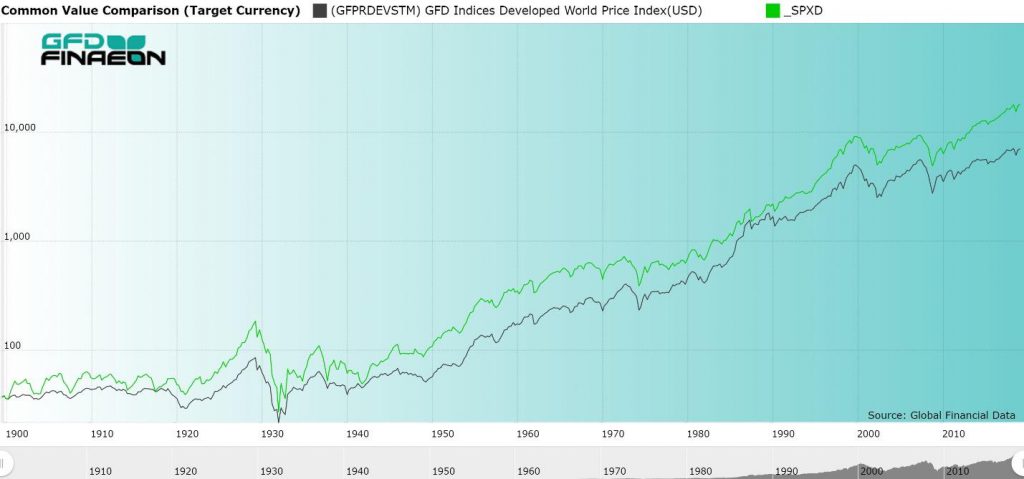
Figure 1. GFD World Equity Index and S&P 500, 1900 to 2019
Figure 2 shows how the United States’ share of global market cap grew during the twentieth century, rising from 30% in 1900 to over 60% by 1929. The United States’ share basically stayed at the 60% level from 1950 to 1980 when Japan’s stock market bubble increased Japan’s share of global market capitalization until 1990 when the Japanese bubble burst.
A history of each of the bear markets that occurred in the 1900s is provided below.
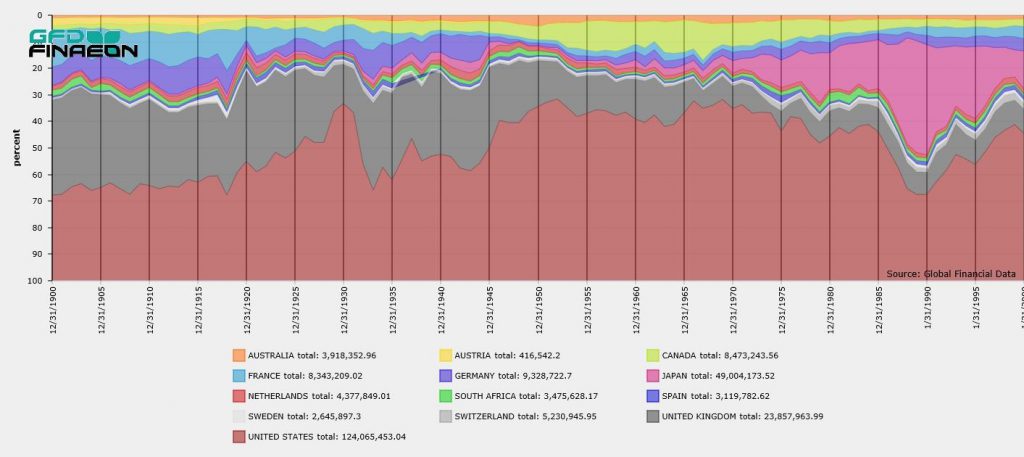
Figure 2. National Shares of Global Market Capitalization, 1900 to 2000
World War I Bear Market (1912-1921)
The global stock market did not suffer any bear markets between 1848 and 1912 when the longest bull market in equity history occurred. London stocks peaked in 1900 and the global stock market peaked in 1912. When World War I began in 1914, every major stock exchange in the world closed, in some cases for a few months, as in the United States, but in other cases, for several years, as in Germany and Russia. It should be remembered that consumer prices doubled in the United States between July 1914 and 1920 and increased even more in European countries. Because of the inflation, stock prices did not decline as much as they would have in a non-inflationary environment. The world index fell 40% between August 1912 and July 1921 in nominal terms, but after allowing for inflation, global stock prices fell 69%, an even worse decline than occurred during the Great Depression between 1929 and 1932.
Most of the decline in stocks occurred during the recession that followed the war. The global stock market fell less than 6% between 1912 and the end of World War I on November 11, 1918, but fell 36% over the next three years. In the United States, stocks fell 35% between July 1919 and August 1921. As Figure 3 illustrates, Germany and France suffered the largest losses of the four major stock exchanges. Investors in Russia lost everything after the Communists took over the country and established the Soviet Union.
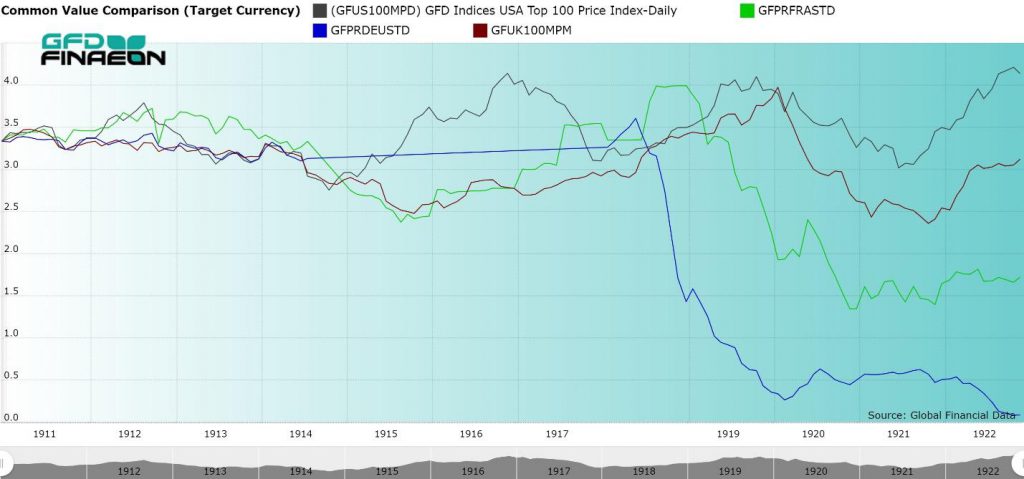
Figure 3. Stock Market Indices for the United States, Great Britain, France and Germany 1910 to 1922
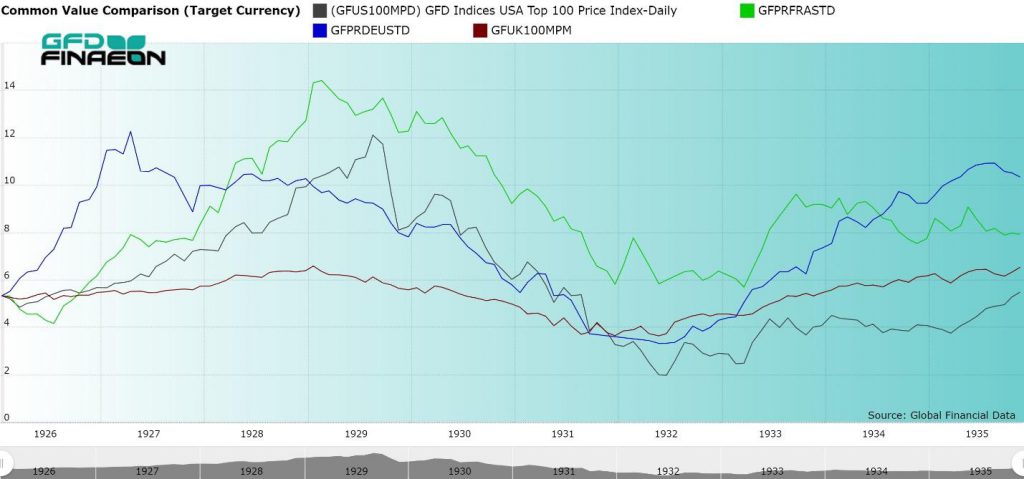
Great Depression Bear Market (1929-1932)
By the fall of 1921, the worst of the decline was over with. The bull market that followed drove prices up in New York, London and Paris, but prices collapsed during the hyperinflation in Germany. Stocks did poorly in northern Europe but bounced back in the rest of the world. This was especially true in the United States where the stock market rose over 400% between its nadir in 1921 and its peak in September 1929. Most of this increase occurred between 1927 and 1929 when automobiles, radio and other industries attracted investment. RCA Corp. rose over 100-fold. As markets in Europe weakened in the late 1920s, money flowed back to the United States pushing stocks higher. Irving Fisher was wrong to say that stocks had reached a “permanently high plateau” because the worst bear market in U.S. history began soon after. Stock markets outside of the United States only rose by 125% between 1921 and 1929. Nevertheless, when the bull market finally crashed, the worst bear market of the twentieth century began.
During the global bear market between 1929 and 1932, the S&P Composite fell 86%, the Global Index fell 75% and the World excluding the USA Index fell 63%. Unemployment in the United States rose to 25% and over 9,000 banks failed as the American economy collapsed. Franklin Roosevelt was elected President in 1932 and after he became President in March 1933, the market began to recover.
Pre-World War II Bear Market (1937-1940)
Attempts to coordinate international economic activity and to settle the debts that accumulated during and after World War I failed. In the United States, President Roosevelt introduced dozens of programs to pull the United States out of the Great Depression, Hitler began rearming Nazi Germany and Stalin industrialized the Soviet Union. Nevertheless, the world lived under the threat of a future war in Japan, China, Austria, Czechoslovakia and other countries.
In the fall of 1937, demand evaporated and a financial panic drove stock prices down in the United States. The DJIA fell from 190 in August to 114 in November as the “FDR depression” occurred. In the United States, auto production halved and steel production fell to 20% of capacity. These declines encouraged countries to rely even more on autarkic policies that avoided international trade. The sinking of the American gunboat Panay by the Japanese in 1937 and the Anschluss in Austria in 1938 put a chill on any hopes that the economy and trade would expand. The decline in London in 1937 was worse than the 1929-1932 bear market. The stock market see-sawed up and down as the world tried to figure out when and whether war would occur. In September, 1939, Germany invaded Poland and World War II began.
Surprisingly, many markets reacted positively to the onslaught of war. Americans saw a new European war as an opportunity for profits. As Germany’s blitzkrieg swept over western Europe stock prices declined until they hit their bottom in May 1940. France surrendered in June 1940, and the bear market came to an end.
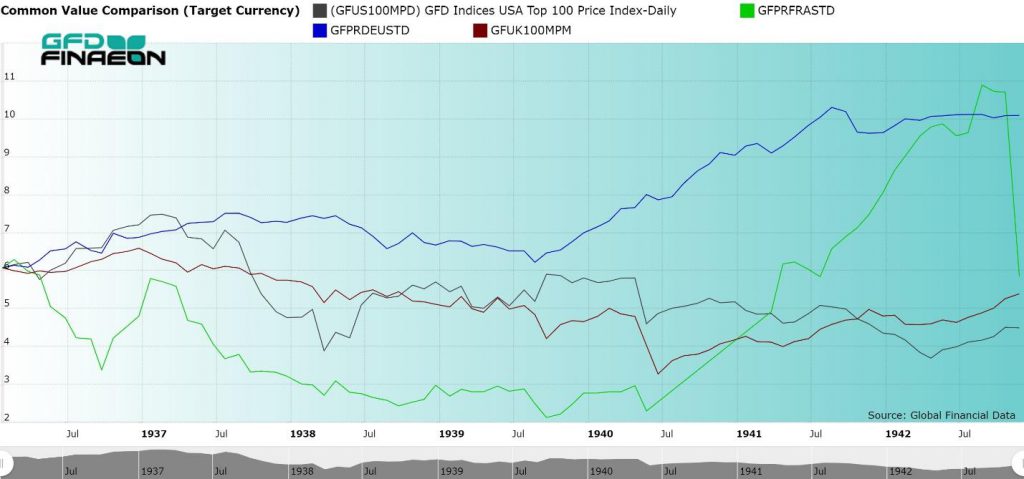
Figure 4. Stock Indices for the United States, United Kingdom, Germany and France, 1937 to 1942
Post-World War II Bear Market (1946-1949)
Stocks generally rose in price during World War II, but there was actually very little trading. Germany used price controls to keep the price of stocks from declining. Money was funnelled to war bonds in the United States and Britain, and inflation took over in France. After the war was over, the fear was that the world would return to the Great Depression of the 1930s. Germany was devastated by the war and since governments had run the economy during World War II, there was little free enterprise to drive the European economy. In the United States, however, earnings and dividends hit record levels after the war. It was primarily the fear of another Great Depression that held stock prices down.
As was true after World War I, pent-up inflation was unleashed after the war. Bretton Woods tried to bring some balance back to the international economy to avoid the competitive devaluations of the 1930s. Germany devalued its currency while France, Italy and other countries suffered high rates of inflation. Important industries were nationalized in Europe reducing stock market capitalization. Stock markets in eastern Europe disappeared as Communism came to power in those countries.
In 1948, Germany was separated into two countries and the Marshall Plan was introduced to help rebuild Europe. In 1949, a realignment of exchange rates under the IMF provided stable exchange rates that prevailed until the 1960s. World Wars I and II were over, and the world began rebuilding in Germany, Japan and the rest of the world.
Vietnam War Bear Market (1968-1970)
It was noted above that this bear market occurred in the World Index, but not in the World Index excluding the United States. The S&P 500 fell 36% between 1968 and 1970 while the World x/USA index fell only 18%. There was no global bear market excluding the United States between 1949 and 1973, the longest bull market of the 1900s.
The bear market in the United States was driven by higher inflation, higher interest rates and concerns over the Vietnam War. The Federal Reserve’s tight money policy and the uncertainty of the war prevented the market from bouncing back. The U.S. market began to make a broad top that pushed the market down until 1982.
OPEC Bear Markets I (1973-1974) and II (1981-1982)
The first major bear market after World War II occurred when OPEC imposed its oil embargo on the world in 1973. Stock market speculation on the “Nifty Fifty” and other high-flying stocks drove up stock prices in the early 1970s, but 1973 saw numerous economic problems which drove the market down over 40% producing the worst bear market since the Great Depression. Between the collapse of Bretton Woods, Watergate, the Yom Kippur War, the OPEC Oil Embargo, the quadrupling of oil prices, inflation, an increase in the prime rate to 11.5% and the recession that followed, stock prices collapsed.
The price of oil rose from $3 to $12 overnight, and both Europe and the United States fell into a recession as unemployment and inflation rose, producing stagflation as the oil price shock hit developed markets. The United Kingdom suffered a bear market that was worse than the Great Depression. London stocks fell 46% between 1929 and 1931, 53% between 1937 and 1940, and 68% between 1972 and 1974. After inflation, London stocks fell over 75%.
As the price of oil approached $40, inflation and interest rates continued to rise. In 1981, the prime rate hit 20.5% and the yield on the 10-year bond hit 15.84%. Paul Volcker was appointed the new Chairman of the Federal Reserve in 1979 and he decided to squeeze inflation out of the economy at all costs. Volcker succeeded, but at the cost of a major recession. After adjusting for inflation, the World Index was lower in 1982 than it had been in 1912. We refer to the period from 1914 to 1982 as the period of Regulation when government influence over the economy through nationalization, regulation and other means restrained the growth of the stock market for decades.
In 1973, floating exchange rates replaced fixed exchange rates, and capital was freed up to flow between countries more easily. This forced countries to liberalize their financial markets leading to dramatic changes in the size of equity, debt, forex and related markets. After 1982, financial globalization began and the stock market exploded upwards.
1987 Stock Market Crash (1987)
The October 19, 1987 stock market crash was as unexpected as it was dramatic. The S&P 500 declined 20.5% in one day and the DJIA fell 508 points, a decline of 22.6%. At the time, analysts compared the 1987 crash with the decline in 1929 and many feared that there would be another Great Depression. Every stock market in the world except Japan followed up on the Wall Street crash with similar declines. The Hang Seng Index in Hong Kong declined 52%, France fell 45% and Germany 46%. The Crash began in the Far East on the morning of October 19, accelerated in Europe and finally collapsed in New York. There was no better illustration of how integrated stock markets had become in the age of financial globalization.
The Depression of 1988 which many feared never came. There were lots of factors that analysts used to determine the cause of the Great Crash including index futures, portfolio insurance, program trading, international disputes over oil, and attempts to manipulate foreign exchange and interest rates. Whatever the cause, the concerted reaction of global stock markets reinforced the fact that stock markets around the world were integrated in a way that had never been true before.
Iraq-Kuwait War Bear Market (1990)
Global stock markets had shown some weakness before the invasion of Kuwait by Iraq, and the recession that accompanied it pushed the stock market into a bear market. The breakdown in negotiations to buy out United Airlines led to the “Black Friday” mini-crash on Friday, October 13, 1989. This was accompanied by the emergence of the Savings and Loan Crisis which cost taxpayers over $160 billion. The American economy was in a recession between July 1990 and March 1991.
On August 2, 1990, Iraq invaded Kuwait. The world rallied behind President George Bush and by February 1991, the Iraqis had been pushed out of Kuwait and the country was liberated. At the time, there was a joke, “What is the difference between the United States and Kuwait?” “The United States is a country without a banking system, and Kuwait is a banking system without a country.” Luckily, these problems were fixed and global stock markets began a bull market rally that lasted for the rest of the decade.
Internet Bear Market (2000-2002)
Although there was no global bear market between 1990 and 2000, there were numerous problems in global financial markets. The introduction of Brady Bonds in 1989 enabled Mexico and other developing countries to convert the debt that had accumulated from bank loans in the 1980s into debts that were partially guaranteed by the U.S. government. This led to the “discovery” of emerging markets as an alternative to developed markets and the inflow of billions of dollars into those markets which were treated as an alternative asset class to developed markets. This also led to credit bubbles which ended in misery in Mexico in 1994, East Asia in 1997, Russia and Argentina in 1998 and in other markets.
During the 1980s and 1990s, developed stock markets throughout the world saw their largest increases in share prices in history. Companies that had been nationalized after World War II were privatized as global stock market capitalization exploded. Meanwhile, the Maastricht Treaty led to the introduction of the Euro in 1999 and dramatically lowered interest rates in Mediterranean economies which previously had suffered from inflation and high interest rates. In the United States, the technology bubble pushed the NASDAQ to unprecedented heights. Capital flooded into global markets, pushing stock prices up throughout the world. By 2000, the world index had increased by a factor of 12 from its level in 1982.
The bear market of 2000-2002 was actually three corrections that were linked together. The Internet Bubble pushed the NASDAQ Index past 5000 and turned firms without sales into billion-dollar corporations before they crashed to zero. The collapse of the internet bubble led the first leg down. NASDAQ fell over 77% between 2000 and 2002 after rising tenfold during the previous decade. The second downturn occurred when the terrorist attacks of 9/11 led to the deaths of almost 3000 people. The final phase was a series of bankruptcies in Worldcom, Enron and other companies which led to the passage of the Sarbanes-Oxley Act.
During these three corrections, the world index lost half of its value by 2002. By then, the excesses that had been generated by the massive capital inflows of the 1990s had been wound down. Stock markets hit bottom and prepared for a new credit bubble driven by the explosion in real estate prices that occurred between 2002 and 2007.
The Great Recession (2007-2009)
Between the collapse of the Bretton Woods system of fixed exchange rates and the Real Estate Bubble of 2007, trillions of dollars flowed in and out of countries seeking the highest rates of return. Because of the crises in East Asia, countries in Asia built up foreign exchange reserves in Dollars to protect themselves from a future crisis. Money flowed into the United States, Iceland, Ireland, Spain and other countries and was invested in real estate which “never drops in price.” Stock markets retraced the climb that had occurred in 2000 and markets peaked in 2007 by which time Finance represented over 20% of the stock market capitalization in the United States.
But real estate does drop in price, and by 2007, so much money was invested in riding the real estate wave that the financial industry fell apart under the weight of all of the investments in real estate. The collapse of Bear Stearns, Indy Mac, Fannie Mae, Freddie Mac, Lehman Brothers, Washington Mutual, and other financial companies led to a 50% decline in U.S. stock markets. The $700 billion Troubled Asset Relief Program (TARP) was introduced to prevent the financial system from collapsing. Banks in Great Britain and Iceland had to be nationalized and Ireland bailed out its banking system.
The S&P Composite declined over 56% and the S&P Finance Index declined by 84%, exceeding the decline of the stock market during the Great Depression when the Finance index fell by 82%. Every major market in the world declined by 50% or more and the World Index fell by 55%. For the second time in ten years, the World index lost half of its value. Central banks rushed into financial markets and saved the global financial system from collapsing by expanding their balance sheets and using Quantitative Easing to buy up government bonds. Although there were fears that this monetary expansion would lead to inflation, this hasn’t occurred. Bond and equity prices have increased dramatically, but the prices of goods and wages have remained restrained.
Toward the Future
When will the next bear market be? How much of a decline will markets suffer? Will it be a relatively minor 20% decline or will markets lose half their value once again?
The stock market suffers a bear market about every ten years. Recent bear markets have occurred in 1973-1974, 1980-1982, 1987, 1990, 2000-2002 and 2007-2009. Although the World Index hasn’t suffered a bear market during the past ten years, the Emerging Market Index suffered 20% declines in 2011, 2014-2016 and 2018 while the World excluding the USA index fell 25% in 2014-2016 and 23% in 2018. However, since the United States hasn’t suffered a bear market since 2009, the World Index has been able to avoid a bear market during the past ten years. Since the United States represents about half of developed market capitalization, until there is a bear market in the United States, a global bear market is unlikely.
Although many global markets are at all-time highs or are close to all-time highs, with interest rates at their lowest levels in history, it seems unlikely that a bear market similar to 2000-2002 or 2007-2009 is on the horizon. There would need to be a period of a year or more for higher interest rates to build up within the economy. The central banks of the world are very conscious of the behavior of the stock market and are doing what they can to avoid a bear market in the near future. Nevertheless, global financial markets are so well integrated today that a bear market could ricochet through global markets very quickly.
Although we have gone 10 years without a bear market, bear markets are inevitable, and even though a new one may be some years off, we wonder whether the large declines of the 1720s, 1820s and 1920s will be repeated in the 2020s. Only time will tell.

Global Financial Data has added a number of sectors to its collection of S&P Sector Indices for the S&P 500 Composite, S&P 400 Midcap, S&P 600 Small Cap and S&P 1500 Supercomposite. During the past few years, S&P has substantially revised its indices and made two major changes. First, S&P added Real Estate as one of the eleven sectors that it divides the stock market into. The reason for this addition is the growth in REITs as investment vehicles. Before this change, real estate stocks were part of the Finance sector. Second, the Telecommunications sector was reorganized as the Communication Services sector. Industries such as Media and Entertainment were moved out of the Consumer Discretionary sector and into Communication Services. Interactive Media and Services were moved out of Information Technology and into Communication Services.
