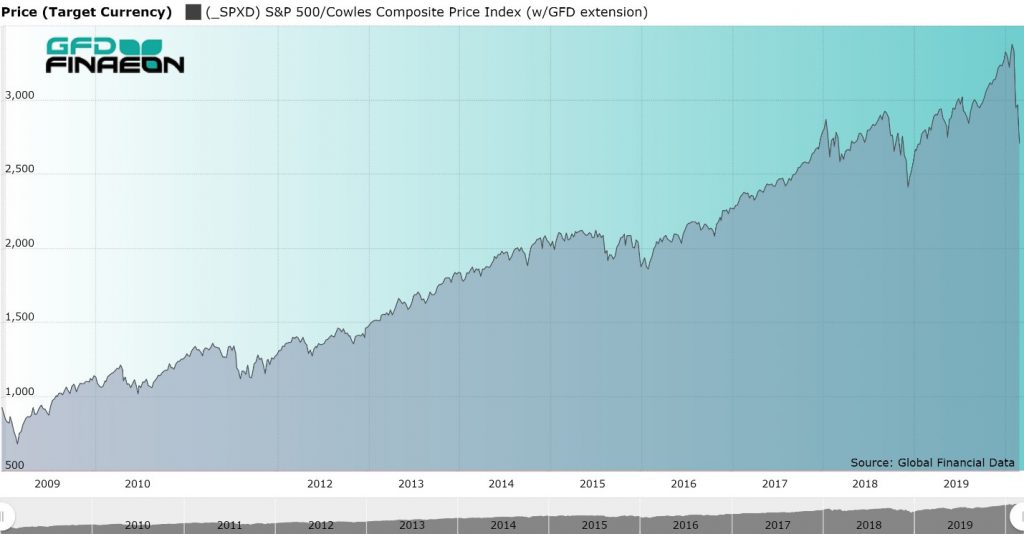
Figure 1. S&P 500, 2009 to 2020
Raging Bull to Roaring Bear
What is interesting about this bear market is how quickly it hit and how sharply markets throughout the world dropped in response to the Coronavirus epidemic. There was no gradual spread of this financial pandemic. It hit all the world’s stock markets severely and simultaneously.
Information of all the bull and bear markets that have affected the American stock market since 1792 and is provided in Table 1. For each market we have provided the date when the bull or bear market hit its top or bottom, the value of the index and the percentage decline in the bear market or percentage rise in the bull market.
Bear Stats are In
By our calculation, there have been twenty-four bull and bear markets since 1792 with four occurring in the 1800s, seventeen in the 1900s and three in the 2000s. The worst decline was the 1929-1932 bear market during which the Dow Jones Industrials declined by 89%. The longest bear market lasted from 1792 until 1843. The strongest bull market occurred between 1974 and 1987 when the market rose by 442%. The two previous bear markets in this century both had declines of 50% in 2000-2002 and 2007-2009.
| Date | Value | Change | Date | Value | Change | Cause |
|---|---|---|---|---|---|---|
| 01/02/1792 | 4.516 | |||||
| 01/31/1843 | 1.497 | -66.85 | 08/31/1853 | 2.584 | 72.61 | Panic of 1837 |
| 10/31/1857 | 1.712 | -33.75 | 07/30/1864 | 4.092 | 139.02 | Panic of 1857 |
| 10/31/1873 | 2.682 | -34.46 | 05/31/1881 | 5.189 | 93.48 | End of Civil War, Panic of 1873 |
| 01/31/1885 | 3.394 | -34.59 | 6/17/1901 | 8.53 | 123.88 | Long Depression |
| 11/9/1903 | 5.85 | -31.42 | 10/9/1906 | 10.23 | 74.87 | Rich Man's Panic |
| 11/15/1907 | 6.10 | -40.37 | 11/19/1909 | 10.6 | 73.77 | San Francisco |
| 10/31/1914 | 6.63 | -37.45 | 11/20/1916 | 10.55 | 59.13 | World War I |
| 12/19/1917 | 6.00 | -43.13 | 7/16/1919 | 9.64 | 60.67 | Fear of Entering War |
| 8/24/1921 | 6.26 | -35.06 | 9/7/1929 | 31.86 | 408.95 | Post-WW I Recession |
| 7/8/1932 | 4.41 | -86.16 | 9/7/1932 | 9.31 | 111.11 | Great Depression |
| 2/27/1933 | 5.53 | -40.60 | 7/18/1933 | 12.2 | 120.61 | Bank Holidays |
| 3/14/1935 | 8.06 | -33.93 | 3/10/1937 | 18.68 | 131.76 | Depression Fears |
| 3/31/1938 | 8.5 | -54.50 | 11/9/1938 | 13.79 | 62.24 | Recession of 1937 |
| 4/28/1942 | 7.47 | -45.83 | 5/29/1946 | 19.25 | 157.70 | World War II approaches |
| 6/13/1949 | 13.55 | -29.61 | 8/2/1956 | 49.75 | 267.16 | Post-WWII Recession |
| 10/22/1957 | 38.98 | -21.65 | 12/12/1961 | 72.64 | 86.35 | Sputnik |
| 6/26/1962 | 52.32 | -27.97 | 2/9/1966 | 94.06 | 79.78 | Steel Strike, Kennedy Panic |
| 10/7/1966 | 73.2 | -22.18 | 1/5/1973 | 119.87 | 63.76 | Viet Nam |
| 10/3/1974 | 62.28 | -48.04 | 8/25/1987 | 337.89 | 442.53 | OPEC Embargo |
| 12/4/1987 | 221.24 | -34.52 | 7/16/1990 | 369.78 | 67.14 | 1987 Crash |
| 10/17/1990 | 294.51 | -20.36 | 3/24/2000 | 1527.46 | 418.64 | Iraq War |
| 10/9/2002 | 776.77 | -49.15 | 10/9/2007 | 1565.15 | 101.49 | Internet Bubble, 9/11 |
| 3/9/2009 | 676.53 | -56.78 | 2/19/2020 | 3386.15 | 400.52 | Financial Recession |
| 3/12/2020 | 2236.70 | -33.95 | Coronavirus |
Table 1. Bear Markets in the United States, 1792 to 2020
The question is, how much more is the stock market likely to fall before we reach a bottom? Will this be a short-lived bear market as occurred in 1987 and 1990 or a more extended bear market as occurred in 2000-2002 and 2007-2009? We certainly hope that the restrictions on travel, reduction in large gatherings, encouragement for social distancing and self-quarantine will be effective in reducing the spread of Covid-19 throughout the United States and the rest of the world so the stock market can regain its losses, build a bottom and begin another bull market. Afterall, who doesn’t love the raging bull?
Events in Time Anniversaries: March 2020
25 years ago: March 1995
S&P 500: 500.71 (vs. 2746.56 in 03/2020) 10-year U.S. Government Bond Yield: 7.20% (vs. 0.56% in 03/2020) Gold: $392.00 (vs. $1676.60 in 03/2020) Oil: $19.175 (vs. $30.59 in 03/2020) GBP/USD: 1.6215 (vs. 1.3047 in 03/2020) US GDP: $7,455 billion (vs. $21,734 billion in 12/2019) US Population: 266 million (vs. 329 million in 2019) 03/01/1995: Yahoo! is incorporated. 03/02/1995: Researchers at Fermilab announce the discovery of the top quark. 03/11/1995: Mines and Energy Minister Ernest Kabushemeye was eaten by cannibals in Bujumbura, Burundi. 03/13/1995: Taliban, tortured and killed Abdul Ali Mazari leader of the Hazara people. The Abacha administration arrested Obasanjo for allegedly supporting a secret coup plot in Nigeria. 03/16/1995: Orange County seeks extensions on the maturities of $1.2 billion in notes, a move that may amount to a default. 03/20/1995: Asarin gas attack on the Tokyo subway kills 13 and wounds 1,300 persons. 03/25/1995: WikiWikiWeb, the world's first wiki, and part of the Portland Pattern Repository, is made public by Ward Cunningham. 03/31/1995: Baseball strike ends after 232 days.50 years ago: March 1970
S&P 500: 89.63 (vs. 2746.56 in 03/2020) 10-year U.S. Government Bond Yield: 7.08% (vs. 0.56% in 03/2020) Gold: $35.30 (vs. $1676.60 in 03/2020) Oil: $3.21 (vs. $30.59 in 03/2020) GBP/USD: 2.4064 (vs. 1.3047 in 03/2020) US GDP: $1,036 billion (vs. $21,734 billion in 12/2019) US Population: 209 million (vs. 329 million in 2019) 03/02/1970: Rhodesia declares itself a republic, breaking its last links with the British crown. 03/04/1970: French submarine Eurydice explodes underwater, resulting in the loss of the entire 57-man crew. 03/05/1970: The Nuclear Non-Proliferation Treaty goes into effect after ratification by 43 nations. 03/17/1970: My Lai Massacre: The United States Army charges 14 officers with suppressing information related to the incident. 03/18/1970: The U.S. postal strike of 1970 begins, one of the largest wildcat strikes in U.S. history. General Lon Nol overthrew Sihanouk and established a republic. Start of the Cambodian Civil War and the US Cambodian Campaign. 03/21/1970: The first Earth Day proclamation is issued by Mayor of San Francisco Joseph Alioto. 03/23/1970: Nixon called in troops for P.O. strike--first time ever against a civil service. 03/28/1970: Gediz earthquake: A 7.2 magnitude earthquake strikes western Turkey at about 23:05 local time, killed 1,086 and injured 1,260.100 years ago: March 1920-+
S&P 500: 8.918 (vs. 2746.56 in 03/2020) 10-year U.S. Government Bond Yield: 5.09% (vs. 0.56% in 03/2020) Gold: $20.67 (vs. $1676.60 in 03/2020) Oil: $6.10 (vs. $30.59 in 03/2020) GBP/USD: 3.87 (vs. 1.3047 in 03/2020) US GDP: $84 billion (vs. $21,734 billion in 12/2019) US Population: 106.46 million (vs. 329 million in 2019) 03/01/1920: BestFoods Inc. (formerly Corn Products Refining and CPC International) added to the Dow Jones Industrial Average 03/08/1920: The Arab Kingdom of Syria, the first modern Arab state to come into existence, is established. 03/14/1920: Communists seize demilitarized Ruhr; Dortmund, Remschied, Hagen, Mlheim, Dsseldorf; 300 people killed (mostly policemen). 03/19/1920: The United States Senate rejects the Treaty of Versailles for the second time (the first time was on November 19, 1919). 03/22/1920: Azeri and Turkish army soldiers with participation of Kurdish gangs attacked the Armenian inhabitants of Shushi (Nagorno Karabakh). 03/27/1920: Hermann Muller (Social Democrats) became Chancellor of Germany200 years ago: March 1820
S&P 500/GFD US-100: 1.529 (vs. 2746.56 in 03/2020) 10-year U.S. Government Bond Yield: 4.478% (vs. 0.56% in 03/2020) Gold: $19.39 (vs. $1676.60 in 03/2020) GBP/USD: 4.44 (vs. 1.3047 in 03/2020) US GDP: $727 million (vs. $21,734 billion in 12/2019) US Population: 9.6 million (vs. 329 million in 2019) 03/06/1820: The Missouri Compromise is signed into law by President James Monroe. The compromise allows Missouri to enter the Union as a slave state, brings Maine into the Union as a free state, and makes the rest of the northern part of the Louisiana Purchase territory slavery-free. 03/08/1820: The king of Spain swears to the constitution; inquisition suppressed. 03/18/1820: Juan Jabat Aztal became Prime Minister of Spain. Evaristo Perez de Castro y Brito became Prime Minister of Spain 03/25/1820: Expulsion of the Jesuits from Russia. © 2020 Global Financial Data. Please feel free to redistribute this Events-in-Time Chronology and credit Global Financial Data as the source.The U.S. stock market fell into a bear market on March 12, 2020 ending the bull market that began in 2009. The bull market had begun on March 9, 2009 and peaked on February 19, 2020. The S&P 500 rose 400% between 2009 and 2020, the Dow Jones Industrials rose 351% between 2009 and 2020. The NASDAQ Composite fell into a bear market in 2018 when it declined 23%, bounced back 58% between 2018 and February 19, 2020. The NASDAQ has fallen 26% since then.
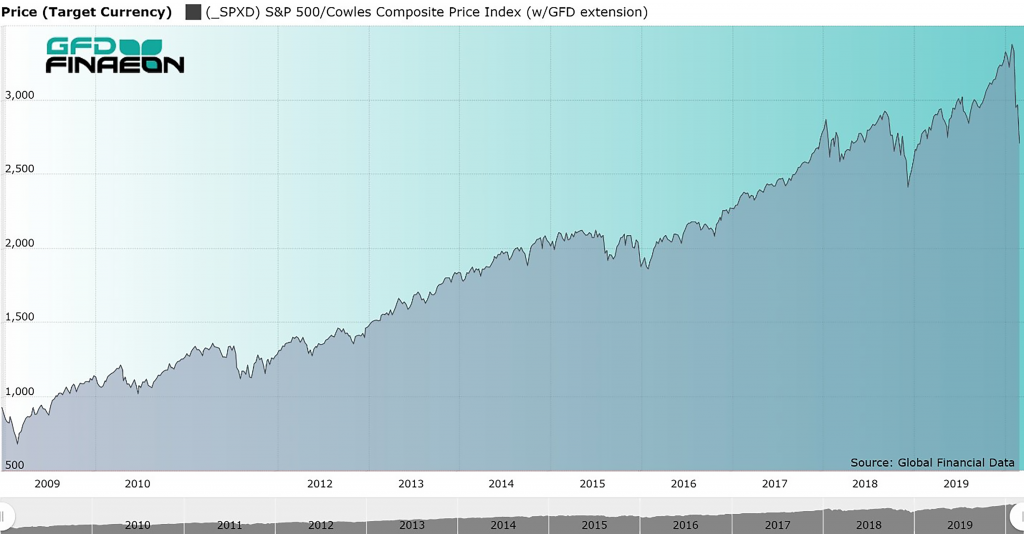 Figure 1. S&P 500, 2009 to 2020
The GFD US-100 Index provides more history than any other stock market index ever developed beginning in the year 1792. By our calculation, there have been twenty-four bull and bear markets since 1792 with four occurring in the 1800s, seventeen in the 1900s and three in the 2000s. The worst bear market was in 1929-1932, led by an 89% decline in the Dow Jones Industrials. The two previous bear markets in this century both had declines of 50% in 2000-2002 and 2007-2009. The 2000 bear market lasted over two years and the 2007 bear market over one year. By comparison, the 1987 and 1990 bear markets only lasted a few months before the market bounced back. What is interesting about this bear market is how quickly it hit and how sharply markets throughout the world have dropped in tandem in response to the Coronavirus epidemic. There was no gradual spread of this financial pandemic. It hit all the world’s stock markets simultaneously. In many countries, the 2020 bear market is a continuation of the bear market that began in 2018.
 Figure 2. United States 10-year Bond Yield, 2010 to 2020
The extent of the bear market in 22 countries and for global indices is provided in Table 1. The table shows the date of the market top, the value the index hit on that date, the change from the previous market low, the current value of the market, and how much each market has fallen since the top in 2018 or 2020. The only major market in the world which has not fallen into a bear market this year is the Chinese market, the country where the coronavirus originated. However, the Chinese market has been in decline since 2015.
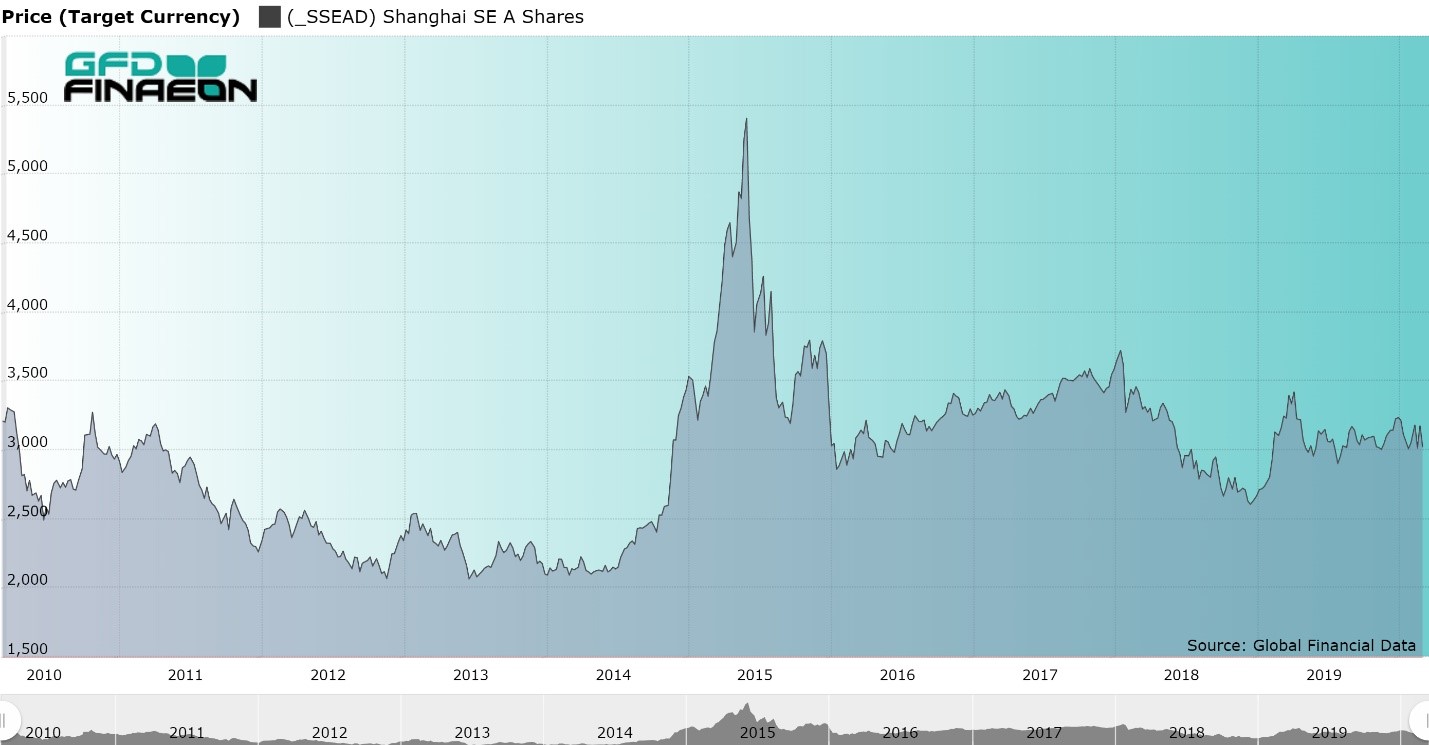 Figure 3. Shanghai Stock Exchange “A” Shares Index, 2010 to 2020
So far, global markets have fallen by around 30-40%. The question is, how much more are the markets likely to fall? Will this be a short-lived bear market as occurred in 1987 and 1990 or a more extended bear market as occurred in 2000-2002 and 2007-2009? It should be noted that fixed-income markets have already hit their bottom. This occurred on March 9 when the 10-year bond yield hit 0.381% and the 30-year bond fell below 1%. Yields have risen since then. Moreover, the Shanghai Index bottomed out on February 3, 2020 when the stock market reopened after the Chinese New Year and has not participated in the worldwide sell off. Both of these are positive signs that the bear market will not continue for an extended period of time. We will update Table 1 on a regular basis so our readers can follow the changes that occur in this bear market.
| Country | Index | Market Top | Value | Change | Market Low | Value | Change |
| Asia | |||||||
| Australia | All-Ordinaries | 2/20/2020 | 7255.2 | 133.16 | 3/23/2020 | 4564.10 | -37.09 |
| China | Shanghai A Shares | 6/12/2015 | 5410.86 | 165.15 | 12/27/2018 | 2600.05 | -51.95 |
| Hong Kong | Hang Seng | 1/26/2018 | 33154.12 | 80.98 | 3/23/2020 | 21696.13 | -32.76 |
| India | BSE Sensex | 1/14/2020 | 41952.63 | 82.79 | 3/23/2020 | 25981.24 | -38.07 |
| Japan | TOPIX | 1/23/2018 | 1911.31 | 59.77 | 3/16/2020 | 1236.34 | -35.31 |
| Singapore | FTSE ST All-Share | 1/24/2018 | 877.87 | 40.38 | 3/23/2020 | 540.60 | -38.42 |
| South Korea | Korea SE Price Index | 1/29/2018 | 2598.19 | 57.21 | 3/19/2020 | 1457.64 | -43.90 |
| Taiwan | Taiwan Weighted | 1/14/2020 | 12179.81 | 56.41 | 3/19/2020 | 8681.34 | -28.72 |
| Europe and Africa | |||||||
| Belgium | All-Share | 4/13/2015 | 13859.94 | 104.31 | 3/18/2020 | 7202.21 | -48.04 |
| France | CAC All-Tradable | 2/12/2020 | 4732.14 | 56.27 | 3/18/2020 | 2888.89 | -38.95 |
| Germany | CDAX Composite | 1/23/2018 | 625.19 | 50.07 | 3/18/2020 | 363.83 | -41.80 |
| Italy | FTSE Italia All-Share | 2/19/2020 | 27675.06 | 39.43 | 3/12/2020 | 16286.37 | -41.15 |
| Netherlands | All-Share Index | 2/12/2020 | 904.31 | 54.15 | 3/18/2020 | 574.88 | -36.43 |
| Norway | OBX Price | 9/25/2018 | 523.06 | 70.44 | 3/16/2020 | 329.67 | -36.92 |
| South Africa | FTSE All-Share | 1/25/2018 | 61684.8 | 246.26 | 3/19/2020 | 37963.00 | -38.46 |
| Spain | Madrid General | 4/13/2015 | 1203.82 | 99.78 | 3/16/2020 | 608.26 | -49.47 |
| Sweden | OMX All-Share Price | 2/19/2020 | 732.67 | 68.35 | 3/23/2020 | 478.95 | -34.63 |
| Switzerland | SPI Price Index | 2/19/2020 | 731.04 | 140.71 | 3/16/2020 | 548.52 | -24.97 |
| United Kingdom | FTSE-100 | 5/22/2018 | 7534.4 | 99.27 | 3/23/2020 | 4993.89 | -33.72 |
| Americas | |||||||
| Brazil | Bovespa | 1/23/2020 | 119528 | 217.51 | 3/23/2020 | 63451.55 | -46.91 |
| Canada | TSE-300 | 2/20/2020 | 17944.1 | 51.52 | 3/23/2020 | 11228.49 | -37.43 |
| Mexico | Mexico IPC | 7/25/2017 | 51713.38 | 206.16 | 3/23/2020 | 32936.60 | -36.31 |
| United States | DJIA | 2/12/2020 | 29551.42 | 351.37 | 3/23/2020 | 18576.04 | -37.14 |
| United States | S&P 500 | 2/19/2020 | 3386.15 | 400.52 | 3/23/2020 | 2236.7 | -33.95 |
| United States | NASDAQ | 2/19/2020 | 9817.18 | 58.52 | 3/23/2020 | 6860.67 | -30.12 |
| Global | |||||||
| Emerging Markets | MSCI Emerging Free | 1/29/2018 | 1278.53 | 85.69 | 3/23/2020 | 758.204 | -40.70 |
| Europe | MSCI Europe | 1/25/2018 | 1926.57 | 47.52 | 3/23/2020 | 1152.698 | -40.16 |
| World | MSCI World | 2/12/2020 | 2434.95 | 35.63 | 3/23/2020 | 1602.105 | -34.20 |
| World | MSCI EAFE | 1/25/2018 | 2186.65 | 46.52 | 3/23/2020 | 1354.30 | -38.07 |
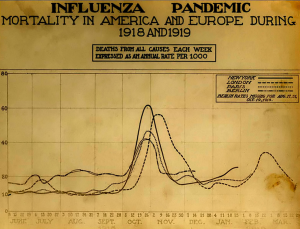 |
Dr. Bryan Taylor, President and Cheif Economist for Global Financial Data, speaks with KPCW, Mountain Money about the impacts the Spanish Flu had on the stock market in 1918 and how we can look at that data to understand the current market and impacts from COVID-19. |


