 Though few people have heard about the collapse of the Hatry Group of companies in September 1929, some people have claimed that it triggered the New York stock market crash of October 1929 and ultimately the Great Depression. Our review of the facts has led us to believe that the collapse of the Hatry Group had little impact on financial markets, despite the claims to the contrary. Hatry no more caused the crash of 1929 than Bernie Madoff caused the Great Recession of 2008.
Clarence Hatry: Flamboyant Entrepreneur
Clarence Hatry was a dedicated self-promoter who never had a chance of being part of the British upper crust. Hatry was the son of a prosperous Jewish silk merchant and was bankrupt by the age of 25. He built his fortune by speculating in oil stocks and promoting industrial conglomerates. Like any entrepreneur, he had spectacular successes and spectacular failures. He built a retail conglomerate, the Drapery Trust, which he sold to the department store Debenhams. He engineered the merger of the London bus corporations into the London General Omnibus Company, ran a stockbroking firm that specialized in municipal bonds, set up the Photomaton Parent Company, which operated a chain of photographic booths, and controlled the Associated Automatic Machine Corporation which owned vending machines on railway platforms. He certainly knew how to diversify his holdings.
The Collapse of the Hatry Group
Hatry’s hubris led him to think that he could rationalize the British steel industry by merging a number of steel and iron companies into the United Steel Companies which he bought for $40 million in what was to be a leveraged buyout, but at the last moment, the bankers withdrew their financing. Hatry began scrambling for cash, and even went to Montagu Norman, the head of the Bank of England to get a bridge loan for the acquisition. Now, you have to understand, this was equivalent to P.T. Barnum going to J.P. Morgan to borrow money for his museum. Norman simply told Hatry he had paid too much for United Steel. Hatry began borrowing money against his companies and eventually committed petty fraud, by forging City of Wakefield 4.5% bonds which he used as collateral to raise money. Corporation and General Securities Ltd. had issued the bonds, raising £750,000 of which only £450,000 was turned over to the city of Wakefield. Rumors about Hatry’s overextension began to circulate and the value of his companies began to plunge. By September 17, Hatry had assets of £4 million and liabilities of £19 million. Hatry knew the end was nigh. If Hatry didn’t know how to enter British society in proper fashion, he certainly exited in proper British form. Hatry called his accountant and admitted to his forgery. His accountant called Sir Archibald Bodkin, the director of public prosecutions and advised him of the “stupendous” scandal and that Hatry would turn himself into the office the next morning. The next day, Hatry had lunch at the Charing Cross Hotel, and went to Sir Bodkin’s office in the Guildhall, where he and three other directors were refused bail. They were remanded to custody.
Hatry’s Revenge
Hatry was sentenced to 14 years in prison for his fraud, of which he served 9 years. While Hatry was in prison, he worked in the prison library. After Hatry was released, he bought into Hatchard’s bookstore in Piccadilly, which is the oldest bookstore in London. The bookstore was doing poorly and Hatry discovered the reason for the store’s poor performance was that many of its customers were using the bookstore as a library and weren’t paying for their books. Hatry told the customers that he planned on removing the books from the book store window and putting a list of what the members of the British elites owed in the bookstore window. This unique method of debt collection worked, the customers settled their bills, and the bookstore was successful. Hatry got payback against the elites who had rejected him. Global Financial Data has produced indices that cover global markets from 1601 until 2018. In organizing this data, we have discovered that the history of the stock market over the past 400 years can be broken up into four distinct eras when economic and political factors affected the size and organization of the stock market in different ways. Politics and economics define the limits of financial markets by determining whether companies can exist in the private or the public sector, by controlling the flow of capital in financial markets, and by determining the level of regulation that companies face in maximizing their profits.
The first era covers the period from 1600 until 1815 when financial markets funded government bonds and a handful of government monopolies. The British East India Company was established in 1600. For the next 200 years, financial markets traded a very limited number of securities. After the bubbles of 1719-1720, shares traded more like bonds than equities. Investors were more interested in getting a secure return on their money than investing for capital gains.
The second period from 1815 until 1914 was one of expanding equity markets, globalization of financial markets, and a reduction in the importance of government bonds relative to equities. This changed in the 1790s when first canals, and later railroads changed the nature of financial markets forever. Investors discovered that transportation stocks could provide reliable dividends as well as capital gains. For the next hundred years, investors had the opportunity to invest in thousands of companies that could generate capital gains as well as dividends. Financial markets became globalized and the transportation revolution enabled the global economy to grow. By 1914, capital flowed freely throughout Europe and the rest of the world, enabling investors to optimize returns globally.
The era of globalized financial markets came to an end on July 31, 1914 when the world’s stock markets closed down when World War I began. During the war, capital was directed toward paying for the war. Attempts to restore globalized financial markets after the war failed. Financial markets operated on a national level, not on an international level. Before World War I, markets provided similar returns because they were integrated. After the war, national equity market returns diverged because capital was unable to flow to the countries with the highest rates of return. After World War II, Europe nationalized many of its main industries and the United States regulated industries.
It wasn’t until the 1980s that equity markets became globalized once again when deregulation and privatization swept over the world’s stock markets. The poor performance of markets and the economy in response to the OPEC Oil Crisis of the 1970s brought the role of government in regulating the economy into question. Privatization swept over the capitalist economies, and the former Communist countries opened stock markets and began to integrate with the world’s financial markets. The global market capitalization/GDP ratio increased dramatically. There is no definitive date when this transition occurred, so the bottom of the bear market in bond and equities in 1981 is used as the starting point of this new era.
Global Financial Data has produced indices that cover global markets from 1601 until 2018. In organizing this data, we have discovered that the history of the stock market over the past 400 years can be broken up into four distinct eras when economic and political factors affected the size and organization of the stock market in different ways. Politics and economics define the limits of financial markets by determining whether companies can exist in the private or the public sector, by controlling the flow of capital in financial markets, and by determining the level of regulation that companies face in maximizing their profits.
The first era covers the period from 1600 until 1815 when financial markets funded government bonds and a handful of government monopolies. The British East India Company was established in 1600. For the next 200 years, financial markets traded a very limited number of securities. After the bubbles of 1719-1720, shares traded more like bonds than equities. Investors were more interested in getting a secure return on their money than investing for capital gains.
The second period from 1815 until 1914 was one of expanding equity markets, globalization of financial markets, and a reduction in the importance of government bonds relative to equities. This changed in the 1790s when first canals, and later railroads changed the nature of financial markets forever. Investors discovered that transportation stocks could provide reliable dividends as well as capital gains. For the next hundred years, investors had the opportunity to invest in thousands of companies that could generate capital gains as well as dividends. Financial markets became globalized and the transportation revolution enabled the global economy to grow. By 1914, capital flowed freely throughout Europe and the rest of the world, enabling investors to optimize returns globally.
The era of globalized financial markets came to an end on July 31, 1914 when the world’s stock markets closed down when World War I began. During the war, capital was directed toward paying for the war. Attempts to restore globalized financial markets after the war failed. Financial markets operated on a national level, not on an international level. Before World War I, markets provided similar returns because they were integrated. After the war, national equity market returns diverged because capital was unable to flow to the countries with the highest rates of return. After World War II, Europe nationalized many of its main industries and the United States regulated industries.
It wasn’t until the 1980s that equity markets became globalized once again when deregulation and privatization swept over the world’s stock markets. The poor performance of markets and the economy in response to the OPEC Oil Crisis of the 1970s brought the role of government in regulating the economy into question. Privatization swept over the capitalist economies, and the former Communist countries opened stock markets and began to integrate with the world’s financial markets. The global market capitalization/GDP ratio increased dramatically. There is no definitive date when this transition occurred, so the bottom of the bear market in bond and equities in 1981 is used as the starting point of this new era.

The Fifth Era: Financial Singularity
Computer scientists talk about the possibility of a technological singularity, when the creation of artificial superintelligence could create computers that exceed human intelligence and lead mankind into a new era. There is a lot of debate about whether this will ever occur or could occur, but some scientists believe it is only a matter of time. We could also think of a future in which there is a financial market singularity, a point at which global financial markets become integrated into a single, 24-hour market that operates independently of national borders and exchanges. With the advent of artificial intelligence and blockchain, a financial singularity has become not only possible, but probable. The main question is not whether this will occur, but when it will occur and how. Equity markets are fully globalized today, and barring any dramatic change in the global political economy, they are likely to remain fully integrated for some time to come. Although there is always the threat of re-regulation of different parts of the economy, nationalization of entire industries seems unlikely. Nationalized firms would be unable to survive in the globalized world that exists today. Asia will continue to increase its share of global market capitalization at the expense of Europe. Today, financial markets are driven by technology which makes it easier and cheaper to integrate financial markets into a single market. The foreign exchange market is a global market that trades 24 hours a day. Money is digital and moves around the world on electronic networks. At some point in the future, equity and bond markets will trade 24 hours a day in a single market. How long it takes to reach that point depends upon technology and politics. Computers will enable markets to become more integrated in the future. Both artificial intelligence and blockchain will enable financial markets to move away from the exchange-based markets that exist today and be replaced by markets that never sleep and reside in the cloud. There is no reason why global financial markets shouldn’t become fully integrated in the near future just as regional stock exchanges have integrated into national exchanges in most of the countries in the world. What still needs to be done is for markets to move toward singularity. Politicians in Europe, America and Asia need to provide the institutional framework that will enable the financial singularity to exist. If politicians fail to create the conditions for integrating national markets into a single international market that operates 24 hours a day, markets will integrate independently of national exchanges. History has shown that existing exchanges rarely lead the way in introducing new technology. Electronic exchanges are born independently of existing exchanges. NASDAQ grew as a challenge to the NYSE and AMEX in 1971. Instinet, Island, Archipelago, BATS, the Investors Exchange and others grew independently of the major exchanges while dark pools trade hundreds of millions of shares daily. Yet, in all of these computerized changes, existing exchanges such as the NYSE was an adapter, not a disrupter, and has been forced to play technological catch-up. During the past 20 years, the NYSE has been behind the curve, following technological changes, not leading them, as its share of the trading of NYSE stocks has slowly declined. Twenty years ago, 80% of trades in NYSE-listed stocks were traded on the NYSE. Today only 30% of consolidated trades take place on the NYSE. More NYSE shares are traded through Nasdaq than on the NYSE, and about 40% of trading is off the exchanges in dark pools. If the stock market in the first half of the 20th Century was 1,000 floor traders trying to out-trade each other, and the second half of the century was 1,000 money managers trying to outsmart one another, the stock market of the 21st century may be 1,000 computer engineers trying to out-program one another. Over the past two centuries, exchanges have lost their advantage of providing price transparency, liquidity and timely execution at a minimal cost. Bonds, commodities and foreign currency have all migrated from exchanges to over-the-counter computers. Institutions trade between themselves and the retail market in shares is collapsing as index funds and ETFs continue to grow in popularity. The NYSE and other exchanges have lost their advantages in the market and their very existence is now in question. Given this, it is our prediction that the financial singularity will occur independently of efforts of existing exchanges to merge into a single market. We believe this will happen in the 2020s, but when and how, we do not know. But even when all this happens, and exchanges disappear, companies will still raise capital by issuing shares to the public, billions of people will still rely upon stocks for their investments, and we will still worry about whether the stock market will go up or go down tomorrow. If you would like to read the full version of this article on the Five Eras of financial markets, please go to: The Five Eras of Financial Markets. Global Financial Data has produced indices that cover global markets from 1601 until 1815 as a first step toward creating a World Index that provides data on equities from 1601 until 2018. As we have discussed in another blog, “The Fifth Financial Era: Singularity,” you can divide financial market history over the past 400 years into four eras of Monopolies and Funds (1600-1815), Globalization (1815-1914), Regulation and Nationalization (1914-1981) and the Return to Globalization (1981-). At some point in the near future, global markets should move toward singularity in which a single market for stocks and bonds operates over the entire planet.
It cannot be understated how much equity markets were transformed between the 1700s and the 1800s. Before 1815, financial markets were primarily geared toward issuing government equities and bonds to investors who wanted consistent, reliable dividend and interest income from their investments. During the 1700s, few investors saw equity markets as a way of generating capital gains by allocating money to new industries. In fact, what differentiates equities in the 1600s and 1700s from the two centuries that followed is the lack of capital gains and investors’ almost total dependence on dividends as a source of return.
Global Financial Data has produced indices that cover global markets from 1601 until 1815 as a first step toward creating a World Index that provides data on equities from 1601 until 2018. As we have discussed in another blog, “The Fifth Financial Era: Singularity,” you can divide financial market history over the past 400 years into four eras of Monopolies and Funds (1600-1815), Globalization (1815-1914), Regulation and Nationalization (1914-1981) and the Return to Globalization (1981-). At some point in the near future, global markets should move toward singularity in which a single market for stocks and bonds operates over the entire planet.
It cannot be understated how much equity markets were transformed between the 1700s and the 1800s. Before 1815, financial markets were primarily geared toward issuing government equities and bonds to investors who wanted consistent, reliable dividend and interest income from their investments. During the 1700s, few investors saw equity markets as a way of generating capital gains by allocating money to new industries. In fact, what differentiates equities in the 1600s and 1700s from the two centuries that followed is the lack of capital gains and investors’ almost total dependence on dividends as a source of return.
The First Financial Revolution
The First Financial Revolution occurred in the early 1600s when the Dutch West India Company, the Dutch East India Company and the English East India Companies were established. The Dutch East India Company was founded in 1601 and continued until it ceased operations in 1799. The Dutch West India Company was established in 1621, went bankrupt in 1674 after losses during the Anglo-Dutch War, and reorganized as a new Dutch West India Company in 1674. The English East India Company was established in 1600 and continued in existence until 1874. Before 1600, merchants had formed “shares” in voyages that ships made to the far east, but the innovation that occurred in 1600 was to vest ownership in a single company, and not in individual voyages. This provided economies of scale and allowed capital from one voyage to be reinvested in other voyages. Shares in these companies were traded at London coffee houses and on the exchanges in Amsterdam and Paris. Of course, many international corporations existed in the 1600s, but few were of sufficient size to enable shares to be traded on a regular basis. In the 1500s, English companies were established enabling the British to trade with Guinea, Senegal, Russia and the Levant, but most of these companies were too small to create a financial market for their shares. What is important about the First Financial Revolution was that it established the principal of founding corporations that could issue shares which did not expire. Shareholders could buy and sell their shares to others, and receive dividends if the company were profitable. A second wave of incorporations occurred in the 1690s. In the Glorious Revolution of 1688 English parliamentarians overthrew King James II and established a constitutional monarchy in England. This not only brought a Dutch ruler to London, but also brought Dutch capital and Dutch financial knowledge. The Phipps treasure-seeking expedition of 1687-1688 paid a 10,000% dividend to shareholders encouraging other corporations to be established. In 1694, the activity in stocks in London was sufficiently large that John Houghton wrote articles on share trading and published a list of the prices of shares traded in London. In January 1698, the Course of the Exchange began its regular bi-weekly publication which lasted into the 1900s. The Amsterdamsche Courant published Dutch share prices fortnightly beginning in 1723, and Les Affiches de Paris began publishing the price of shares traded in Paris in 1745. Between these three publications, we have been able to put together data on share prices from 1601 until 1815. The 1600s and 1700s were a period of almost continual war in Europe and the debt of the English, Dutch and French rose as a result. Governments in the Netherlands and Great Britain began issuing debt that had longer maturities, in some cases creating annuities that provided annual payments as long as the bondholder was alive. These debt instruments eventually were converted into perpetuities which never matured just as shares in the East India Company and the Bank of England never matured. Given the choice of obtaining a perpetuity that paid a fixed yield from a government or variable dividends from a corporation, most investors chose to invest in the government security. Because of its consistency in payment, Britain was able to increase its debt to twice its GDP by 1815 while the yield on government debt fell from 8% in 1701 to 3% in 1729 when the annuities were introduced. Between 1688 and 1789, British government debt grew from £1 million in 1688 to £244 million in 1789 and £745 million in 1815. During that same period of time the market cap of British shares grew from £1 million in 1688 to £30 million in 1789 and £60 million by 1815. The market cap of shares, which was equal to outstanding government debt in 1688 shrank to less than 10% of government debt by 1815. Although the number of available bonds and shares was limited, the market was global. In the 1780s, government debt from Spain, Austria, Russia, Sweden, France and Great Britain all traded in Amsterdam. But the Napoleonic wars led to default by all of these countries except Great Britain. By 1800, the Dutch West India Company and Dutch East India Company as well as the French East India Company were all driven into bankruptcy.Equity markets in the 1600s and 1700s
Data on companies from the 1600s is extremely limited. Data are available for only two companies from the Netherlands, the Dutch East India Company (1601-1698) and the Dutch West India Company (1628-1650). The data before 1690 depends almost exclusively on the Dutch East India Company which was the largest corporation in the world in the 1600s and one of the largest corporations in financial history. For more information on the Dutch East India Company, see the blog, “The First and the Greatest: The Rise and Fall of the United East India Company.” Nevertheless, we have price data, shares outstanding and dividend information, the three primary components that are needed to put together a stock market index. Unlike corporations in England, shares in the Dutch East India Company were allocated by municipality, many dividends were paid in kind, shares could not be traded and cleared as easily as they were in London, and the company never issued new shares, but instead issued so much debt that the company eventually went bankrupt. The key event for financial markets between 1600 and 1815 was the Bubble of 1719-1720. The Dutch, French and British governments all issued large amounts of debt to fight the War of the Spanish Succession between 1701 and 1713. John Law offered the French a way of converting their government debt into equity in the French East India Company. In Britain, investors were allowed to convert their debt into shares in the South Sea Company. Enthusiasm for the shares and government manipulation drove prices of the stocks up to unsustainable levels. Governments in both Paris and London passed laws that directed all capital into the French East India Company and the South Sea Company, but after the crash, companies were restricted from raising additional capital and few companies issued new shares for the rest of the 1700s. Almost all of the activity in the Netherlands came from the Dutch West India Company and the Dutch East India Company. The only other company of any prominence was the Societeit von Berbice which settled Dutch Guyana. The French East India Co. was the primary corporation that traded in Paris until the Caisse d’Escompte and Compagnie des Eaux de Paris began trading in 1787. These corporations ran into problems during the French Revolution. On August 24, 1793, the Committee of Public Safety banned all joint-stock companies and seized the assets and papers of the French East India Company. Directors of the company bribed French officials so the company could oversee its liquidation rather than the government. When this was discovered, key Montagnard deputies were executed, leading to the downfall of Georges Danton. We have to rely on the London Stock Market for most of the companies that make up the world index between 1692 and 1815. Among the more important companies for which we were able to collect data on prices, dividends and shares outstanding were the Royal African Company (1692-1742), the East India Company (1692-1815), the Bank of England (1694-1815), the New East India Company (1698-1708), the Million Bank (1700-1749), the South Sea Co. (1711-1815), the London Assurance Co. (1720-1750) and the Royal Exchange Insurance Co. (1735-1753). The Bank of Scotland was founded in 1695, the Royal Bank of Scotland in 1727 and the British Linen Co., which acted as a bank, in 1745, but unfortunately, data on these and other companies was unavailable for inclusion in the index. Although London lacked a formal exchange until 1801, trading occurred at coffee shops around Exchange Alley and the prices of shares were recorded in The Course of the Exchange. In addition to shares, the 3% Annuities began trading in 1729 and the 3% Consolidated Bonds in 1757. Other government debt was issued and traded, but most of the activity in London, Paris and Amsterdam was in English bonds. Only companies for which we were able to obtain share price data, share outstanding data and dividends are included in the index. Any company that lacked all of these three variables was excluded.
Figure 1 illustrates the performance of GFD’s Global Index of Stocks from 1601 until 1815. The data from 1601 until 1692 is exclusively from the Dutch East India Company. After the Glorious Revolution in 1688, interest in London shares increased. The price of shares rose from 1692 until 1718, leading to the explosion that occurred during the Bubble of 1719-1720. Although the South Sea bubble is probably the better known of the two bubbles, the rise and fall was even more dramatic in France, where shares of the French East India Company went from 315 livres in 1718 to 10,000 livres in 1719. In England, South Sea Company shares rose from 100 pounds to 1000 pounds then fell back to 100.


The relative impact of the Bubbles of 1719-1720 is illustrated in Figure 4 with the French index showing the greatest volatility, the English index increasing several fold, and the Dutch index increasing the least. After 1720, there was very little activity in any of the three indices. The Dutch index gradually declined as the Dutch East India Company’s excessive debt grew. The French East India company collapsed during the French Revolution, but British stocks maintained their value.
The behavior of bonds is illustrated by the graph of the English Annuity/Consol in Figure 5. The wars the English fought in the 1700s drove the price of English bonds down and increased the yield during the Seven Years War (1754-1763), American Revolution (1776-1783) and French Revolutionary Wars (1792-1802). The price of bonds declined and the yield on bonds increased over the course of the 1700s.

Returns to Stocks and Bonds
Table 1 shows the returns to stocks and bonds in France, the United Kingdom, the Netherlands, the United States and the world from 1602 until 1815. Unfortunately, the years covered by each country differs so direct comparisons between the returns to stocks and bonds in different countries is difficult. What is obvious is the overall lack of capital gains. Almost all of the return came from dividends for stocks and interest for bonds.| Table 1. Annual Returns to Stocks and Bonds, 1602 to 1815 | |||||
| Country | Securities | Years | Price | Dividends | Return |
|---|---|---|---|---|---|
| France | Bonds | 1746-1815 | -0.23 | 3.17 | 2.93 |
| France | Stocks | 1718-1793 | -1.78 | 6.95 | 5.05 |
| France | Stocks | 1801-1815 | -1 | 5.31 | 4.26 |
| Netherlands | Bonds | 1788-1815 | -6.27 | 2.85 | -3.6 |
| Netherlands | Stocks | 1602-1794 | -0.24 | 4.76 | 4.51 |
| United Kingdom | Bonds | 1700-1815 | -0.23 | 4.46 | 4.22 |
| United Kingdom | Stocks | 1692-1815 | 0.08 | 4.57 | 4.65 |
| United States | Bonds | 1786-1815 | 3.54 | 4.86 | 8.57 |
| United States | Stocks | 1791-1815 | -0.76 | 6.5 | 5.69 |
| World | Bonds | 1700-1815 | 0.2 | 5.52 | 5.73 |
| World | Stocks | 1602-1815 | 0.95 | 5.7 | 6.7 |
The Period of Monopolies and “the Funds”
The bonds that were issued by the British government was known as “the Funds”, and the period from 1600 to 1815 differed from the period after 1815 in several important ways. 1. There were only a handful of companies available to investors before 1815; after that, there were hundreds. 2. Most of the companies that existed before 1815 were tied to the government, not private corporations that developed new industries. 3. Before 1815, almost all of the return came through dividends, but after 1815, capital gains became increasingly important to investors. 4. During the Napoleonic Wars, outside of England, national government bonds almost all defaulted on their debt and corporations went bankrupt. 5. Before 1815, government debt grew dramatically while the market cap of equities changed little. After 1815, these trends reversed and government debt declined relative to GDP while the market cap of shares increased dramatically. The lack of any major wars between 1815 and 1914 freed up capital that was used to build the infrastructure of the world. Although the first stock markets were established in 1600, stock markets as we know them today weren’t really established until the 1800s when shares in hundreds of corporations became available to investors. The performance of shares after 1815 will be covered in a future blog.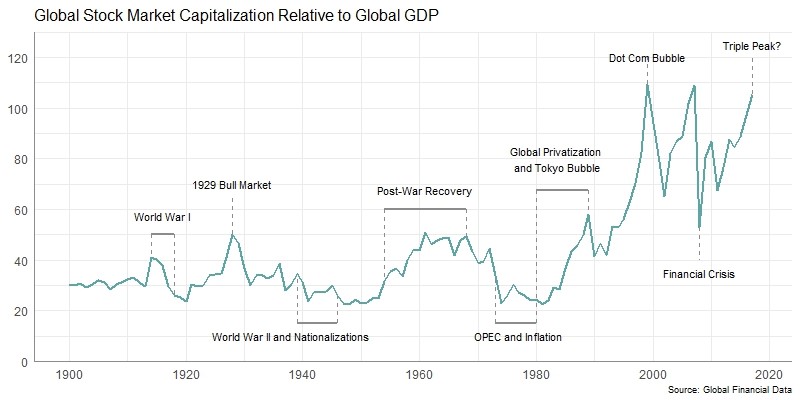
Global Financial Data has produced indices that cover global markets from 1601 until 2018. In organizing this data, we have discovered that the history of the stock market over the past 400 years can be broken up into four distinct eras when economic and political factors affected the size and organization of the stock market in different ways. Politics and economics define the limits of financial markets by determining whether companies can exist in the private or the public sector, by controlling the flow of capital in financial markets, and by determining the level of regulation that companies face in maximizing their profits. The first era covers the period from 1600 until 1815 when financial markets funded government bonds and a handful of government monopolies. The British East India Company was established in 1600. For the next 200 years, financial markets traded a very limited number of securities. After the bubbles of 1719-1720, shares traded more like bonds than equities. Investors were more interested in getting a secure return on their money than investing for capital gains. The second period from 1815 until 1914 was one of expanding equity markets, globalization of financial markets, and a reduction in the importance of government bonds relative to equities. This changed in the 1790s when first canals, and later railroads changed the nature of financial markets forever. Investors discovered that transportation stocks could provide reliable dividends as well as capital gains. For the next hundred years, investors had the opportunity to invest in thousands of companies that could generate capital gains as well as dividends. Financial markets became globalized and the transportation revolution enabled the global economy to grow. By 1914, capital flowed freely throughout Europe and the rest of the world, enabling investors to optimize returns globally. The era of globalized financial markets came to an end on July 31, 1914 when the world’s stock markets closed down when World War I began. During the war, capital was directed toward paying for the war. Attempts to restore globalized financial markets after the war failed. Financial markets operated on a national level, not on an international level. Before World War I, markets provided similar returns because they were integrated. After the war, national equity market returns diverged because capital was unable to flow to the countries with the highest rates of return. After World War II, Europe nationalized many of its main industries and the United States regulated industries. It wasn’t until the 1980s that equity markets became globalized once again when deregulation and privatization swept over the world’s stock markets. The poor performance of markets and the economy in response to the OPEC Oil Crisis of the 1970s brought the role of government in regulating the economy into question. Privatization swept over the capitalist economies, and the former Communist countries opened stock markets and began to integrate with the world’s financial markets. The global market capitalization/GDP ratio increased dramatically. There is no definitive date when this transition occurred, so the bottom of the bear market in bond and equities in 1981 is used as the starting point of this new era. How long the fourth era will last before we move into a fifth era will depend upon technology. The fifth financial era will begin when financial markets reach singularity, where the national markets in financial assets merge into one market and financial markets are not just global, but singular. All financial assets will trade 24 hours a day over computer networks that are connected to every corner of the globe. Markets have almost reached that point in the foreign exchange market, and it is only a matter of time before the market for financial assets reaches that point as well.
The First Era: Monopolies and Funds
A Financial Revolution occurred in 1600 when the Dutch East India Company and the English East India Companies were established. The Dutch East India Company was founded in 1601 and continued to operate until 1799. The English East India Company was established in 1600 and reorganized three times before the fourth East India Company was established in 1657. That company lasted until 1874. Before 1600, merchants had created “shares” in voyages that ships made to the far east. By investing in several ships, merchants could reduce their risk. The innovation of the Dutch East India Company was to vest ownership in the company, and not in individual voyages. This provided economies of scale and by creating perpetual life for the corporation, allowed capital from one voyage to be reinvested in other voyages. What is important about the Financial Revolution of 1600 was that it established the principal of founding corporations that could issue shares which did not expire. Shareholders could buy and sell their shares to others, and receive dividends if the company was profitable. Nevertheless, the Dutch East India Company made several mistakes which future companies learned from. The Dutch East India company allocated its shares by municipality, which limited trading in its shares. The company did not raise additional equity capital by issuing new shares, but borrowed money which increased its debt-to-equity ratio and eventually ended up bankrupting the Dutch East India Company. Moreover, dividends were often paid in kind. Instead of receiving cash dividends, shareholders would receive cloves brought back from the West Indies. Merchants were happy to receive payment in kind and sell the cloves, but investors preferred cash payments. A second wave of incorporations occurred in the 1690s following the Glorious Revolution of 1688, during which English parliamentarians overthrew King James II and established a constitutional monarchy in England. This not only brought a Dutch ruler to London, but also brought Dutch capital and Dutch financial knowledge. In 1688, Amsterdam financial markets were more sophisticated than London’s. Joseph de la Vega’s Confusion de Confusiones was published in 1688 to show the Jewish community of Amsterdam the inner workings of stock markets. When the William Phipps treasure-seeking expedition of 1687-1688 paid a 10,000% dividend to shareholders, it encouraged other corporations to be established for investors to profit from. In 1694, John Houghton began writing articles on share trading and in January 1698, the Course of the Exchange began its regular bi-weekly publication, publishing trade prices collected from London coffee houses. A similar publication for Amsterdam was the Amsterdamsche Courant which published share prices fortnightly beginning in 1723. Les Affiches de Paris began publishing the price of shares traded in Paris in 1745. By the middle of the 18th century, the growth of the financial press reflected the growing interest in financial markets. Between these three publications and others, GFD has been able to put together data on share prices from 1601 until 1815. The 1600s and 1700s were a period of continual war in Europe and the debt of the English, Dutch and French rose as a result. Governments in the Netherlands and Great Britain began issuing debt that had longer maturities, in some cases creating annuities that provided annual payments as long as someone was alive. These debt instruments eventually were converted into perpetuities which never matured just as shares of stock in the East India Company or the Bank of England never matured. Given the choice of obtaining a perpetuity that paid a fixed yield from a government and variable dividends from a corporation, most investors chose to invest in the government security.

The key event for financial markets was the bubbles of 1719-1720. The market cap of British equities steadily rose from 1688 until 1720 as is illustrated above. The Dutch, French and British governments all issued large amounts of debt to fight the War of the Spanish Succession between 1701 and 1713. John Law offered the French government a way of converting their debt into equity in the French East India Company. In Britain, investors were allowed to convert their debt into shares in the South Sea Company. Enthusiasm for the shares drove prices of the stocks to unsustainable levels, but after the crash in 1720, companies were restricted from raising additional capital and few companies issued new shares for the rest of the 1700s. Investors wanted a reliable cash flow, and after the bubbles of 1719-1720, only the largest monopolies backed by the government were seen as reliable enough to warrant investment. Most financial capital went into government bonds. Even the few companies that survived the bubble behaved more like bonds than equities, changing little in price. Between 1688 and 1789, British government debt grew from £1 million in 1688 to £244 million in 1789 and to £745 million in 1815. During that same period of time the market capitalization of British shares grew from £1 million in 1688 to £30 million in 1789 and £60 million by 1815. The market cap of shares, which was equal to outstanding government debt in 1688 shrank to less than 10% of government debt by 1815. Because of its reliability in payment, Britain was able to increase its debt to levels twice GDP by 1815, while the yield on the debt declined, falling from 8% in 1701 to 3% in 1729 when the annuities were introduced.
The Second Era: Globalization
The process of globalization began in the 1780s and continued to grow until 1914. The Bank of Ireland and the Grand Canal went public in 1783-1784, and government debt from the major European powers traded on the Amsterdam stock exchange in the 1780s. However, the Napoleonic Wars bankrupted most of Europe. During the Napoleonic Wars, the Dutch West India Company and Dutch East India Company as well as the French East India Company were all driven into bankruptcy while the Netherlands, France, Austria, Russia, Spain, Sweden and the United States all defaulted on their debt. Britain was the only country that didn’t default. French and Dutch debt was reissued at a loss to bondholders, but British debt continued to pay on time attracting more investors to British government debt. It cannot be understated how much equity markets were transformed between the late 1700s and the early 1800s. Before 1815, British financial markets were primarily geared toward issuing bonds, or “the Funds” as they were called, to investors who wanted consistent, reliable dividend and interest income from their investments. In the 1790s, things started to change. The first canal bubble occurred in the 1790s as dozens of canals in the midlands of England issued shares to raise capital to build canals across Britain. In 1789, Alexander Hamilton reorganized the finances of the United States and the Bank of the United States was founded in 1791, issuing $10 million in capital to investors. The Bank of the United States was followed by the incorporation of dozens of other banks and insurance companies that raised capital in the United States. The Federal government and state governments all issued new debt. The Banque de France was established in 1800, the London Stock Exchange was founded in 1801, and The Course of the Exchange expanded to two pages, covering over 100 companies in 1811. The canal mania of the 1810s, the Latin American mania of the 1820s and the Railroad mania of the 1840s created hundreds of new companies that investors bought shares in as a way to make quick profits in financial markets. Debt from American states and the French Funds were listed in The Course of the Exchange in 1825. During the 1830s, new railroad companies were established throughout Europe and the United States and millions of dollars were poured into these companies. Europe remained at peace from 1815 until 1914 and government debt as a share of GDP declined. This is illustrated in Figure 2 below which shows the continuous rise in British government debt from almost nothing in 1688 to over 200% of GDP by 1815 and steadily declined to 1914.

The market cap of equities rose steadily as British debt declined as is illustrated in Figure 1. The market capitalization of British equities as a share of GDP rose between 1688 and 1720, then declined from 1720 until 1800. The market cap of shares began to rise in the 1840s and continued to increase until 1914 when the market cap of outstanding shares exceeded GDP. During the same time, outstanding British government debt declined from over 200% of GDP in 1815 to under 30% in 1914. The growth in investment in equities wasn’t limited to railways. British capital flowed to investments outside of Britain after 1860, going into American railways, Indian railways, Argentine and Brazilian shares and other equities. Britain helped build the railways of the world. Capital also went into government bonds. Japan issued its first bonds in London in 1870, and dozens of other countries followed in their footsteps. A similar pattern occurred in the United States where the ratio of market capitalization to GDP rose dramatically between the beginning of the Civil War and the beginning of World War I. The market capitalization of US equities was only about 10% of GDP in 1860, but rose to 70% by the beginning of World War I. Most of this money went into railroads, but it also flowed into Standard Oil, U.S. Steel, General Motors and dozens of other industrial companies. There were direct links between London and New York that enabled British investors to buy shares directly in New York and in other financial capitals.
Although these financial trends were most apparent in Britain and the United States, the globalization of financial markets occurred in every market in the world. By the beginning of World War I, there were hundreds of companies trading simultaneously in New York, Paris and Berlin. London became the financial center of the world. Not only was London able to fund railroads that in Britain, but London also funded railroads, banks and utilities in almost every country in the world. London funded companies not only in all of its colonies, including Canada, India, South Africa and Australia, but also in Latin America, Mexico and the United States. Although the United States funded the majority of the railroads that stretched from the Atlantic to the Pacific, British and Dutch investors pour hundreds of millions of dollars into American equities and bonds. South African mining companies excited investors in London, Paris and Berlin during the late 1800s and early 1900s. Equity and bond markets were truly global and billions of pounds were invested in new stocks and bonds every year. We can divide the process of globalization into two periods. During the first period from the 1830s until the 1860s, corporations were able to raise money in London, Paris and Berlin to build railroads that covered the European continent. By the 1870s, Germany and Italy were unified and the gold standard fixed exchange rates between all the world’s major economies. From the 1860s until 1914, capital flowed from London to the rest of the world to build the global infrastructure in railroads, telegraphs, finance and utilities. The transcontinental railroad was built across the United States and railroads were built in India, China and other countries. The Suez Canal listed jointly in Paris and in London. Eastern European countries listed in Berlin. Russian companies listed in St. Petersburg while Chinese companies listed in Shanghai and Hong Kong. The Gold Standard provided fixed exchange rates between all the world’s global economies, making it easy to transfer money from one country to another. By 1900, it was no longer necessary to ship gold from one country to another to take advantage of exchange-rate differentials. Instead, Russian government debt or American railroads could be bought and sold to move capital from one country to another. By the beginning of the 1900s, money began flowing into industrial stocks, banks and insurance companies, mining stocks, especially in South Africa, and other new industries. Energy stocks such as Standard Oil, tobacco stocks such as British Tobacco, electricity stocks such as General Electric, automobile companies such as General Motors and hundreds of others all drew in capital when there was no place left to build railroads. The financial world in 1790 and in 1914 were completely different. In 1790 there was only a handful of companies that investors could put their money in and government debt represented 90% of outstanding financial instruments. By 1914, government debt had shrunk in size relative to GDP and through capital markets, money flowed into every country in the world to build the global economy. Virtually no one in 1913 could have guessed that this would all soon come to an end.
The Third Era: The Great Reversal
World War I destroyed the globalized financial markets which existed before 1914. By July 31, 1914, virtually every stock market in the world had closed to prevent shareholders from selling their stocks and bonds and repatriate their money. Capital was no longer free to cross borders. Financial markets faced restrictions they had never faced before. During World War I, capital flowed into government bonds, not corporate coffers. Even when stock exchanges reopened, price restrictions limited the amount of trading that could occur. The Berlin and St. Petersburg stock exchanges didn’t reopen until 1917, and the St. Petersburg stock exchange closed soon after when the October Revolution struck Russia. The period from 1914 until 1981 was one of government control over financial markets through regulation after World War I, and nationalization of the largest companies in Europe after World War II. Capital controls limited the ability of money to flow from one country to another. Stock markets’ access to foreign funds became severely limited. Before 1914, global financial markets were integrated and bond interest rates converged to the international average. After 1914, national stock and bond markets moved independently of one another and different domestic inflation rates and risk of default produced different interest rates in each country. Wars are run by governments, not by free markets. World War I and II were total wars and heavy industry, infrastructure, utilities, transports, finance were all put under the control of government in order to win the war. Once government began controlling different sectors of the economy during the war, governments wanted to maintain control through regulation or nationalization after the war. Many consumer markets evaded the purview of government control, but the government wanted to exercise control over any large corporation. Between 1914 and 1981, there was an ebb and flow between greater market freedom and greater regulation, but there was no real push for the privatization of the sectors that had been nationalized or regulated until the 1980s. There were periods when equity markets appeared to succeed in the 1920s and in the 1950s and 1960s, but during the other decades, equity markets were not allowed the freedom they needed to provide growth to the rest of the economy. During the 1920s, governments tried to return the world to the “normalcy” that had prevailed before July 31, 1914, but failed. Germany and several other Eastern European countries sank into hyperinflation that wiped out investors. German bondholders and shareholders lost virtually everything they had during the hyperinflation of 1923. England’s attempt to return to the Gold Standard proved a failure leading to a recession and forcing Britain to leave the Gold Standard in 1931. The collapse of the Creditanstalt bank in Vienna in 1931 affected banks throughout Europe. The collapse of equity markets in the United States led to the regulation of securities in the United States by the SEC in 1934. After World War I, stock markets were based upon national capital markets. When the Austro-Hungarian empire broke up, new stock exchanges appeared in the capitals of each new country. After World War I, each country had its own stock exchange, but after World War II, many of these stock exchanges disappeared when Communism took over in Eastern Europe. The Nazis defaulted on their debts in the 1930s and restricted capital flows into security markets so available capital could be focused on rebuilding the German military. Capital could not flow from one country to another as had occurred before World War I. When World War II began stock exchanges were better prepared for war and few exchanges shut down. Instead, price controls limited trading in shares, as in Germany, and trading eventually ground to a halt. Britain nationalized the railways, the Bank of England, the steel industry and other companies after World War II. Similar nationalizations occurred in France and other European countries. Some stock exchanges never reopened in countries that went Communist. In Germany, the currency conversion of 1948 made shares in Deutsche mark worth 10% of their value in Reichsmark. After World War II, transports, utilities, finance and other heavy industry were regulated in the United States and nationalized in Europe. Nationalization removed those industries from stock markets in Europe and restricted their size in the United States. Because transports, utilities and banks were regulated in the United States, their profits were restricted and their capitalization was reduced. The Paris Stock Exchange was closed by strikes in April 1974 and March 1979, symbolizing that the conflict between capital and labor was more important than promoting capital markets. In the late 1940s, even more restrictions were placed on international capital flows. The IMF introduced a system of fixed exchange rates based upon the Dollar to replace the chaos that existed before World War II. The Bretton Woods agreements only worked by restricting capital flows across borders, so capital was raised domestically or not at all. After World War II, many of the industries in Europe were nationalized and the ratio of market capitalization to GDP shrank dramatically outside of the United States. By 1950, global market cap was equal to less than 25% of world GDP, and of this, the United States, United Kingdom, Canada and Australia represented about 80% of global market cap. Outside of the Anglo-American countries, equity markets had very little influence on the economy. European capitalization shrank because major portions of the economies were nationalized by the government.
The Fourth Era: The Return of Globalization
Although the date when Regulation and Nationalization replaced Globalization on July 31, 1914 is precise, the transition from Monopoly to Globalization between 1789 and 1815 and the return of Globalization between 1973 and 1990 are not so clearly dated. We will set the beginning of the Return of Globalization at 1981 when interest rates peaked and equities were in a bear market. Independent national financial markets no longer worked and the integration of global financial markets was seen as a solution to allocating capital more efficiently. One of the key beneficiaries of the return of Globalization was Asia. Japan and other Asian countries showed a dramatic rise in exports to the rest of the world and growth in their share of global market capitalization reflected this. The stock markets of Japan, Korea, Taiwan and Singapore illustrated to the rest of the world that stock markets could successfully allocate capital. Asian market capitalization was less than 5% of the world until the 1960s, but by the 1980s, Asia’s share of global market cap was greater than Europe’s, and by 1989 Asian countries represented almost half of global market capitalization. The Shanghai and Shenzhen stock exchanges were established in 1991 and China’s share of global market cap began its inexorable rise. The rise of Asia is illustrated in Figure 4.

Although Bretton Woods and other post-war economic accords brought much-needed stability and recovery to the international economy, the global economy faltered in the 1970s. Keynesian policies were originally seen as a way of smoothing out the economic cycle, but by the 1970s, high inflation had pushed inflation up to double-digit levels in almost every country in the world. The economies of Communist countries failed even more than capitalist economies. After the Soviet Union collapsed in 1991, stock markets were reestablished in St. Petersburg and other former Communist countries including China. European governments privatized industries that had been nationalized after World War II, and in the United States regulated industries were deregulated. This process began under President Carter in the United States. Deregulation affected banks, railways, telecommunications and utilities, the steel industry, airlines, and other infrastructure-related industries. Bretton Woods based international capital markets on the U.S. Dollar, but in 1973, floating exchange rates replaced fixed exchange rates. In the 1980s, capital controls were lifted and once again, capital could flow freely between different countries. The Big Bang in London reestablished London as the financial center of Europe. Europe pushed for a common market which would allow labor, goods and capital to travel freely in Europe and enable companies to gain economies of scale by operating across the European continent rather than being restricted to operations within one country. Information technology and biotechnology became the leading industries in the United States and other parts of the world. Money flowed into technology companies in the 1990s and at the height of the bubble in technology stocks in 1999, for the first time in history, global equity capitalization exceeded global GDP. This is illustrated in Figure 5 which shows not only the dramatic growth in the ratio of market cap to global GDP, but the increased volatility that has come with this growth.

Privatization was promoted by Thatcher in Britain and Reagan in the United States. In France, Francois Mitterand initially nationalized parts of the economy, but two years later reversed course and privatized both the industries he had nationalized as well as industries that had been nationalized before Mitterand was elected President. Industry had been owned by the state in Communist countries and once these countries allowed the market to allocate resources, the governments privatized state industries by providing shares in these companies to their citizens. Today, hundreds of millions of people depend upon the stock market for their retirement. Sovereign wealth funds have invested trillions into the stock market to provide money to their citizens in the future. These trends are unlikely to reverse. It would be hard to imagine the world returning to the regulated capital markets of the 1940s and 1970s. The changes that have occurred in financial markets during the twenty-first century have been driven by technology, not government deregulation. The Dot.com Bubble of the late 1990s pushed global market cap above global GDP for the first time in history. Virtual exchanges exist independent of any location. It seems unlikely that war, nationalization or regulation will push financial markets back to the condition they were in before 1981. It seems more likely that technology will push global markets into a new era in which multiple markets are replaced by a single market for all financial assets throughout the world. This would return the world to the globalized financial markets that existed before 1914.
The Fifth Era: Financial Singularity
Computer scientists talk about the possibility of a technological singularity, when the creation of artificial superintelligence could create computers that exceed human intelligence and lead mankind into a new era. There is a lot of debate about whether this will ever occur or could occur, but some scientists believe it is only a matter of time. We could also think of a future in which there is a financial market singularity, a point at which global financial markets become integrated into a single, 24-hour market that operates independently of national borders and exchanges. With the advent of artificial intelligence and blockchain, a financial singularity has become not only possible, but probable. The main question is not whether this will occur, but when it will occur and how. Equity markets are fully globalized today, and barring any dramatic change in the global political economy, they are likely to remain fully integrated for some time to come. Although there is always the threat of re-regulation of different parts of the economy, nationalization of entire industries seems unlikely. Nationalized firms would be unable to survive in the globalized world that exists today. Asia will continue to increase its share of global market capitalization at the expense of Europe. Today, financial markets are driven by technology which makes it easier and cheaper to integrate financial markets into a single market. The foreign exchange market is a global market that trades 24 hours a day. Money is digital and moves around the world on electronic networks. At some point in the future, equity and bond markets will trade 24 hours a day in a single market. How long it takes to reach that point depends upon technology and politics. Computers will enable markets to become more integrated in the future. Both artificial intelligence and blockchain will enable financial markets to move away from the exchange-based markets that exist today and be replaced by markets that never sleep and reside in the cloud. There is no reason why global financial markets shouldn’t become fully integrated in the near future just as regional stock exchanges have integrated into national exchanges in most of the countries in the world. What still needs to be done is for markets to move toward singularity. Politicians in Europe, America and Asia need to provide the institutional framework that will enable the financial singularity to exist. If politicians fail to create the conditions for integrating national markets into a single international market that operates 24 hours a day, markets will integrate independently of national exchanges. History has shown that existing exchanges rarely lead the way in introducing new technology. Electronic exchanges are born independently of existing exchanges. NASDAQ grew as a challenge to the NYSE and AMEX in 1971. Instinet, Island, Archipelago, BATS, the Investors Exchange and others grew independently of the major exchanges while dark pools trade hundreds of millions of shares daily. Yet, in all of these computerized changes, existing exchanges such as the NYSE was an adapter, not a disrupter, and has been forced to play technological catch-up. During the past 20 years, the NYSE has been behind the curve, following technological changes, not leading them, as its share of the trading of NYSE stocks has slowly declined. Twenty years ago, 80% of trades in NYSE-listed stocks were traded on the NYSE. Today only 30% of consolidated trades take place on the NYSE. More NYSE shares are traded through Nasdaq than on the NYSE, and about 40% of trading is off the exchanges in dark pools. If the stock market in the first half of the 20th Century was 1,000 floor traders trying to out-trade each other, and the second half of the century was 1,000 money managers trying to outsmart one another, the stock market of the 21st century may be 1,000 computer engineers trying to out-program one another. Over the past two centuries, exchanges have lost their advantage of providing price transparency, liquidity and timely execution at a minimal cost. Bonds, commodities and foreign currency have all migrated from exchanges to over-the-counter computers. Institutions trade between themselves and the retail market in shares is collapsing as index funds and ETFs continue to grow in popularity. The NYSE and other exchanges have lost their advantages in the market and their very existence is now in question. Given this, it is our prediction that the financial singularity will occur independently of efforts of existing exchanges to merge into a single market. We believe this will happen in the 2020s, but when and how, we do not know. But even when all this happens, and exchanges disappear, companies will still raise capital by issuing shares to the public, billions of people will still rely upon stocks for their investments, and we will still worry about whether the stock market will go up or go down tomorrow.
