Global Financial Data has collected data on companies from South Africa that listed in London during the 1800s and 1900s. Between 1835 and 1985, over 400 South African companies listed in London. Before 1890, there were fewer than 20 South African companies in London, but once gold was discovered in the 1890s, the number of South African companies mushroomed, increasing to 45 in 1890 and over 100 by 1902. South African companies also listed in Paris where they traded on the Coulisse Exchange as well as in Amsterdam, Berlin and other stock exchanges because European investors wanted to profit from the South African gold rush.
Until now, indices on South African stocks were based upon the index of commercial and industrial shares that listed in Johannesburg. Data before 1947 used indices from C. G. W. Schumann and A. E. Scheurkogel’s Industrial and Commercial Share Price Indices in South Africa. Unfortunately, Schumann and Scheurkogel did not include mining shares, and as in Australia, this produced an upward bias to the South African indices. We have combined the data from mining shares listed in London with commercial and industrial shares that listed in Johannesburg to create a new index for South Africa.
South Africa Before 1960
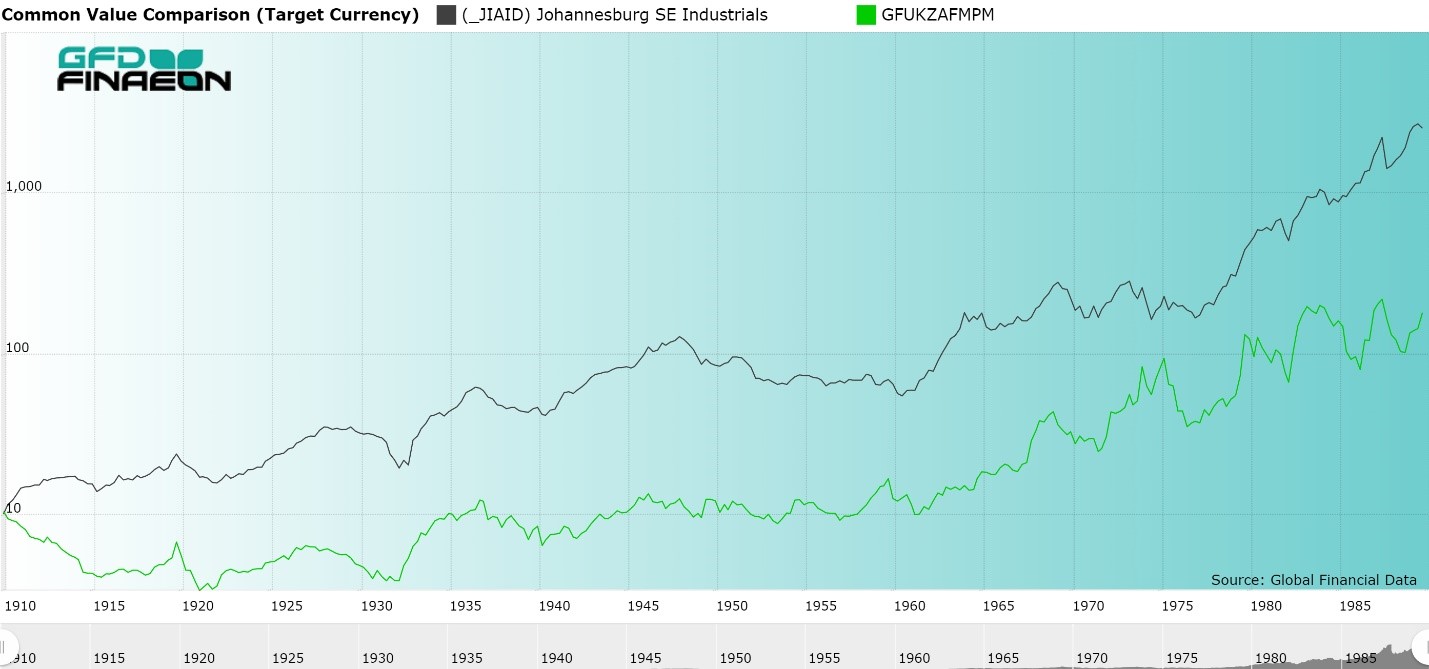
The pre-1960 South Africa industrials index included only industrial and commercial shares. The index was a weighted arithmetic average of price relatives, weighted by the average market value of companies, and based upon weekly prices in Johannesburg and Cape Town. The index was compiled by the University of Stellenbosch, and after 1947 by the Reserve Bank of South Africa. Between 1910 and 1947, the Schumann and Scheurkogel price index rose by 6.77% per annum, excluding dividends. During the same period of time, GFD’s index of shares that were listed in London rose by only 3.22%. As in Australia, commercial and industrial shares outperformed the mining side of the stock market to a degree that makes the results hard to believe. It is curious that most of the outperformance of the Schumann and Schurkogel index occurs before 1947, but since 1947 when the South African index has been calculated in “real time”, the outperformance disappears. Figure 1 compares the performance of the South African Industrial and Commercial Index with the GFD London shares index from 1910 until 1985.
Until now, GFD was unable to calculate a total return index before 1960 because we lacked data on dividend yields prior to that date. We used the data on individual companies that listed in London to calculate both price and return indices for South African stocks from 1835 until 1985. This enabled us to use the pre-1910 data from London to create an index of South African shares going back to 1835. From 1910 until 1960, we combined the GFD London index with the South African Commercial and Industrial index, and beginning in 1960, we used the JSE All-Share Index to bring the series up to 2019.
We used the GFD South African Shares in London index from 1835 until 1910. We weighted both the London mining shares and South African Commercial and Industrial shares at 50% between 1910 and 1960, and used the JSE All-Share index from 1960 until 2019. We used the dividend yield on shares in London before 1960 to produce a return index that included not only capital gains and losses, but reinvested dividends as well.
Between 1834 and 2018, the South African index rose by 4.34% per annum; however, most of this increase came from inflation. Between 1895 and 2018, the index rose by 5.83% per annum, but inflation increased by 4.85%. leaving an increase after inflation of less than 1% per annum. If you add in dividends, the total return increases to 6.45% per annum. Between 1895 and 2018, the total return index rose by 9.16% providing a dividend yield of 4.11%.
If you compare the old industrial index with the new all-share index, you can see the change that adding the mining stocks to the index creates. The old industrial index produced a 6.29% increase between 1910 and 2001 while the new All-Share index produced a 4.11% annual return. By omitting the mining shares in South Africa, the annual return increased by over 2% per annum. If you look at the data collected by Dimson, Marsh and Staunton, South Africa had the highest returns of any country they track. By making these adjustments, the returns to South African stocks appear to be more realistic and South Africa no longer provides the highest return of any country in the world.
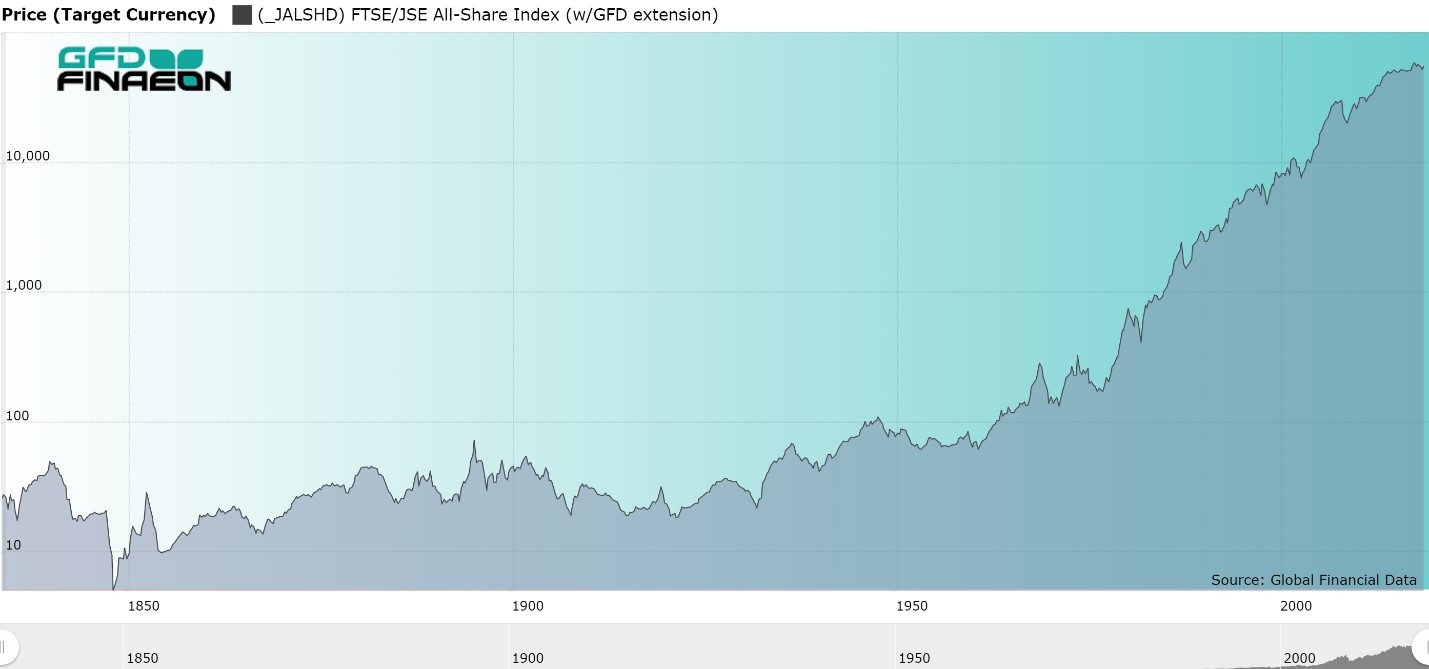
Figure 2 graphs South Africa’s price index from 1834 to 2018. As can be seen, the index made virtually no progress from 1834 until 1933, and the real increase in the index didn’t begin until after 1960. It was only then, after lying dormant for 100 years, that South African stocks began to rise in value. Part of the reason for this was the inflation in the price of gold which began in the 1960s which translated into higher prices for South African mining stocks.
| Period | Stock Price | Stock Return | Bonds | Inflation | Real Return |
|---|---|---|---|---|---|
| 1834-1932 | 0.20 | 2.41 | 1.01 | 1.39 | |
| 1932-1960 | 4.25 | 10.25 | 3.50 | 2.98 | 7.06 |
| 1960-2018 | 6.41 | 10.38 | 5.46 | 3.74 | 6.40 |
| 1834-2018 | 2.61 | 6.36 | 2.16 | 4.11 | |
| 1860-2018 | 3.14 | 7.70 | 4.63 | 2.41 | 5.17 |
| 1899-2018 | 3.66 | 9.71 | 4.38 | 3.01 | 6.50 |
Table 1 summarizes the returns to South African stocks in US Dollars between 1834 and 2018. The annualized return between 1834 and 2018 was 4.11% after inflation. Between 1860, when government bond data becomes available, and 2018, the annual nominal return to stocks was 7.70% and 4.63% to bonds. Since 1900, stocks have returned 9.71% and bonds 4.38%. The real return of 6.5% to stocks since 1900 is comparable to the real return to stocks in the United States of 6.3%.
Conclusion
Historical data on South African stocks have had an upward bias because mining stocks, which represented a substantial portion of the total market share, were excluded from the index until the 1960s. GFD has calculated indices of mining shares, and has produced an index of South African mining shares that can fill in this gap. We have recalculated the South African index, and produced lower results that are comparable with returns in other countries.
