The Dow Jones Transportation Average has been calculated on a real-time basis longer than any stock market index in the world. The “20 Active Stock” index was introduced by Charles Dow on September 23, 1889 and included 18 railroad stocks and 2 industrial stocks. Dow had introduced a 12-stock average that included 10 railroad stocks and 2 industrial stocks on January 1, 1886 and most of the stocks that were included in the 12-stock average were also included in the 20-stock average. Initially, the 20-stock average was simply a broader version of the 12-stock average. It should be remembered that in the 1880s, virtually all of the stocks that traded on the NYSE were railroad stocks. Industrial stocks didn’t begin to take their place on the NYSE until the 1890s. The real change occurred in 1896. On May 12, 1896, the 12-stock average was replaced with a new 12-stock average that only included industrial stocks, giving birth to the Dow Jones Industrial Average. On October 25, 1896, the two industrial stocks that were included in the 20-stock average, Western Union and Pacific Mail Steamship, were removed and the 20-stock average became the Dow Jones Railroad Average (DJRA). The DJRA remained a rail average of 20 stocks until January 2, 1970 when the average was changed to the Dow Jones Transport Average (DJTA). Nine railroad stocks were removed from the DJRA and replaced with nine airline and trucking stocks. Today, only four railroads remain in the DJTA. All told, there have been 130 stocks in the DJRA/DJTA during the past 131 years, some making multiple appearances. GFD’s Version of the Dow Jones Transportation Average Global Financial Data has made three additions to the Dow Jones Transportation Average that are not available from other data vendors. First, GFD has extended the data for the DJTA from 1889 back to 1832. Global Financial Data has added 67 years of data and over 13,000 daily data points to the Dow Jones Transportation Average. GFD’s version of the average now begins in 1832 and provides daily data covering 185 years. . To put this data together, GFD found the top 40 railroads by capitalization each year from 1832 to 1889. Then GFD determined which of those 40 stocks had the greatest number of observations in each year and used that information to choose the 25 stocks for GFD’s railroad average. We then spliced our own calculations before 1889 onto the Dow Jones Transportation Average to create a continuous series. A graph of the DJTA and the GFD-100 is provided in Figure 1. As you can see, there was little change in the rail index until the Civil War began. Then there was a sharp rise in railroad stocks between 1861 and 1864, and a gradual increase in the DJTA until 1929. Since over 80% of the capitalization of the stock market in the late 1800s consisted of rail stocks, the market as a whole largely reflected the changes in the rail index. During the Great Depression, the DJTA collapsed in price. It is interesting that by the 1930s, the DJTA was at the same level it had been at in the 1830s. Between the 1830s and the 1930s, all of the return to shareholders came in the form of dividends. That is why it important to have a total return index in addition to the price index. Since the 1940s, the DJTA has steadily risen in price. 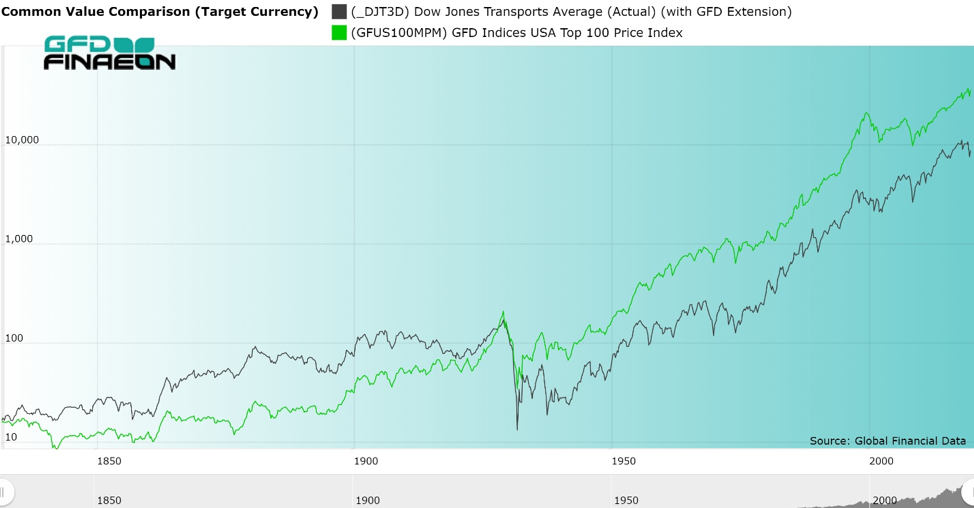 Figure 1. Dow Jones Transportation Average and GFD-100 Index, 1832 to 2020 Second, Although the NYSE was closed between July 31, 1914 and December 12, 1914, GFD has collected data on the bid and ask prices for the DJTA components while the NYSE was closed and has recalculated the average during that period of time. This allows users to analyze how railroad stocks behaved during the period when the NYSE was closed in 1914. The DJTA closed at 89.41 on July 30, 1914 when the NYSE suspended operations. By the time the first quotations were available on August 24, the DJTA was already above its July 30 close at 91.42. The DJTA hit its low on October 24 at 83.94, then gradually rose to reopen at 90.21 on December 12, above the level it had closed at on July 30, 1914. Third, GFD has calculated a total return index for the DJTA beginning in 1889 when Dow introduced the 20 Active Stock Average. We have used the total return index from the GFD Railroad Index to extend the total return data back to 1832. Dow Jones began calculating a total return index for the DJTA on September 30, 1987 when the index was at 1047.68. By the end of May 2020, the price index had reached 8969.79 while the return index had reached 14574.41. But what happened before September 1987? We decided to recalculate the DJTA by determining the amount of quarterly dividends that would have been paid to shareholders who owned the DJTA and adjusting the index for the payment of those dividends. Recalculating the Dow Jones Transportation Average Of course, in 1889, there were no computers which could calculate the Average in real time as occurs today. At the end of each day, Charles Dow simply added up the price of each of the stocks in the Average and divided the total by 20. That gave him the average value of the stocks that were included in the DJRA. It should be remembered that until October 13, 1915, stocks that were listed on the NYSE were quoted as a percentage of par, so if each stock had been at par, whether the par value for the stock was $50 or $100, the average price would have equaled 100. As stocks deviated from their par value, the index would change to reflect the new prices. Dividends were also quoted as a percentage of par, so as long as prices and dividends were quoted as a percent of par, calculating the average was simple. During the 1800s, preferred stocks were sometimes traded as much if not more than the common stocks of some companies in the DJRA. Northern Pacific Preferred traded more than the common stock so the preferred was included in the DJRA rather than the common stock. Before World War I, many railroads paid dividends only twice a year, not quarterly. On October 13, 1915, the NYSE changed their rules and decided to quote all stocks at their nominal dollar value, not as a percent of par. This meant that Pennsylvania Railroad, Philadelphia & Reading and Lehigh Valley stock, which each had a $50 par, were quoted at half of their former price. In order to calculate the Average, you had to assume that two shares of those three companies were included in the Rail Average. Of course, stocks paid stock dividends, but these were generally ignored by Dow Jones. If a stock paid a 10% dividend or even a 25% dividend, it did impact the price of the stock, driving the price down by the amount of the stock dividend, but until stock splits occurred, these were ignored by Dow. Of course, you have to understand the difference between a stock split and a stock dividend. A stock dividend provided you more of the same par stock. If a company had 1,000,000 shares of $100 par stock outstanding and issued a 20% stock dividend, you would have 120 shares of $100 par stock rather than 100 shares. The price of the stock would decline by about 20%, but no more. What this does is to create a downward bias in the DJTA. Dow ran into problems calculating the Dow Jones Industrial Average (DJIA) in the 1920s because many of the stocks that were in the DJIA split. In the case of Texaco (then known as the Texas Co.), the first DJIA stock to split, shareholders received 4 new $25 par shares in exchange for 1 old $100 par share. So how do you deal with that? Simply take the new price of the stock, multiply by 4 and assume the Average now included four shares of Texaco instead of one. But Texaco wasn’t the only stock to split. It was followed by American Car & Foundry, General Electric, Studebaker, American Locomotive, American Can, American Tobacco and Sears. Each time a stock split, you had to multiply the number of shares in the DJIA by the size of the split, so by 1928 the DJIA included 4 Texaco, 2 American Car & Foundry, 4 General Electric, 2.5 Studebaker, 2 American Locomotive, 6 American Can, 2 American Tobacco and 4 Sears shares. Calculating the DJIA was getting very complicated. Although splits were not a problem in the DJRA, Dow came up with a solution to this problem in 1928. It introduced the concept of a divisor. Now you added up the price of all the stocks and instead of dividing by the number of stocks in the Average, you divided by the divisor. If a new stock were added or a stock split, you simply changed the value of the divisor. The divisor for the DJRA was set at 20 on October 1, 1928. Since then, the divisor has steadily declined, and today the divisor for the DJTA stands at about 0.16385. If you want to calculate the value of the DJTA on your own, sum up the price of the 20 members, divide the sum by 0.16385 and you will get the value of the Dow Jones Transportation Average. As you can see, what first looks like a very simple process of adding up the values of the stocks and the dividends and adjusting the prices of the stocks for those dividends is in reality a very complicated action. Nevertheless, it is doable. We were able to collect quarterly dividend data for the DJTA from the Dow Jones Handbooks back to 1938. This meant that we would have to collect dividend data on the stocks that were included in the Dow Jones Transportation Average before 1938 and recreate the dividend values. Our goal was to create a quarterly “dividend” that would be paid out to the Dow Jones Transportation Average just as if it were a stock. We collected data for each of the components of the index going back to 1889 and adjusted the dividends because either the stock had a $50 Par and had to be doubled in price, or there was a stock split. All of this data for the DJTA is available to subscribers to the Global Financial Database. The data for the GFD Rail/Transport Average back to 1832 is in _DJT3D and the data for the Dow Jones Rail/Transport Total Return Average is available in _DJTTRD. The quarterly dividends can be found in the file USDJTADQ and the annual sum of the quarterly dividends in USDJTADM. The dividend yield for the DJTA is available in USDJTAYM. We have calculated total returns back to 1889 when the 20-stock index was introduced and used the GFD Railroad Index beginning in 1832.
 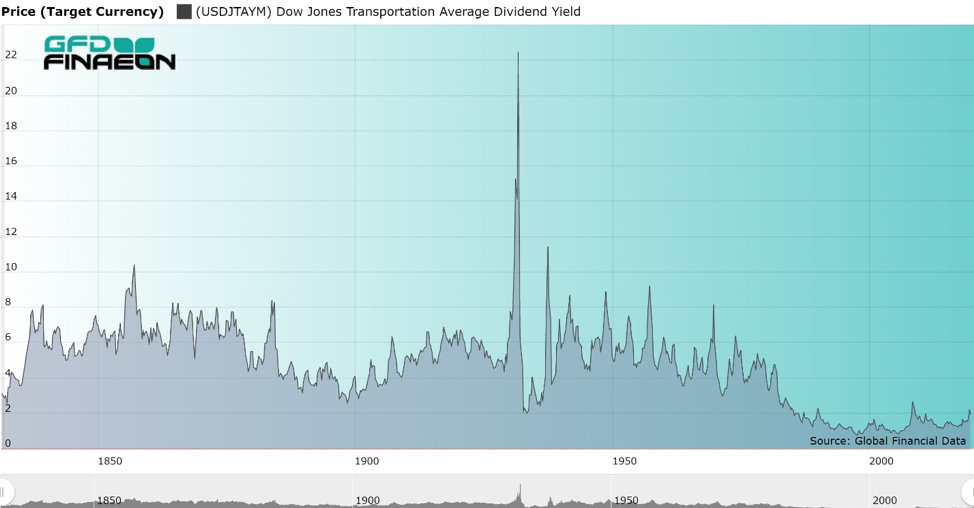 Figure 2. GFD Railroad Index – Dow Jones Transportation Average Dividend Yield, 1832 to 2020 The dividend yield for the GFD Railroad Index and Dow Jones Transportation Average is provided in Figure 2. The yield averaged around 6% during most of the 1800s. This reflected the opportunity cost of investing in government bonds and the risk that railroad bonds displayed. Because there were restrictions on government bonds, railroad bonds were the most popular form of investment in the 1800s. Beginning in 1889, the yield of the DJTA is used in the chart. The yield steadily declined between the 1940s and 1990s, but has risen since then.
 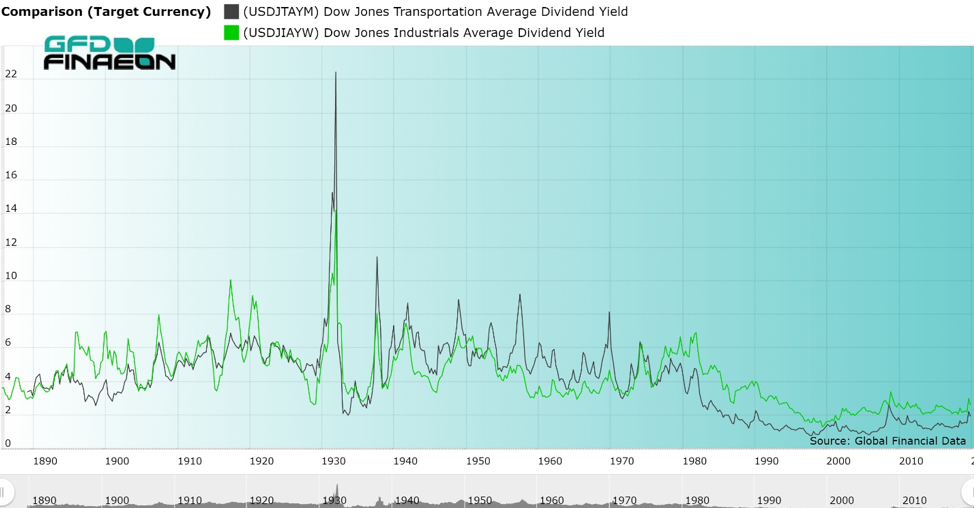 Figure 3. Yields on DJTA and DJIA, 1886 to 2020 Yields on the DJTA and the DJIA from 1886 until 2020 are provided in Figure 3. While the yields display similar patterns, there are some differences. The yields for the DJIA were more volatile before World War I than for the DJTA, but after World War II, this pattern changed and the DJTA yields became more volatile than the DJIA yields. Since the 1970s, the DJTA has generally had a lower yield than the DJIA and this continues to be true today. During the Great Depression, the yield on the DJTA exceeded 20% as rail stock prices declined before railroads cut their dividends, as most did in 1932. Dividends paid on stocks in the DJTA and the DJIA are illustrated in Figure 4. Until the 1920s, the dividends paid on the DJIA were more volatile than the dividends paid on the DJTA. Dividends paid on DJTA stocks declined until around 1897, then gradually rose until 1929. On the other hand, dividends paid on the DJIA collapsed during each bear market until the 1920s. Dividends paid on the railroads collapsed during the 1930s as can be seen in Figure 4. Since then dividends paid for both the DJIA and the DJTA have steadily risen.
 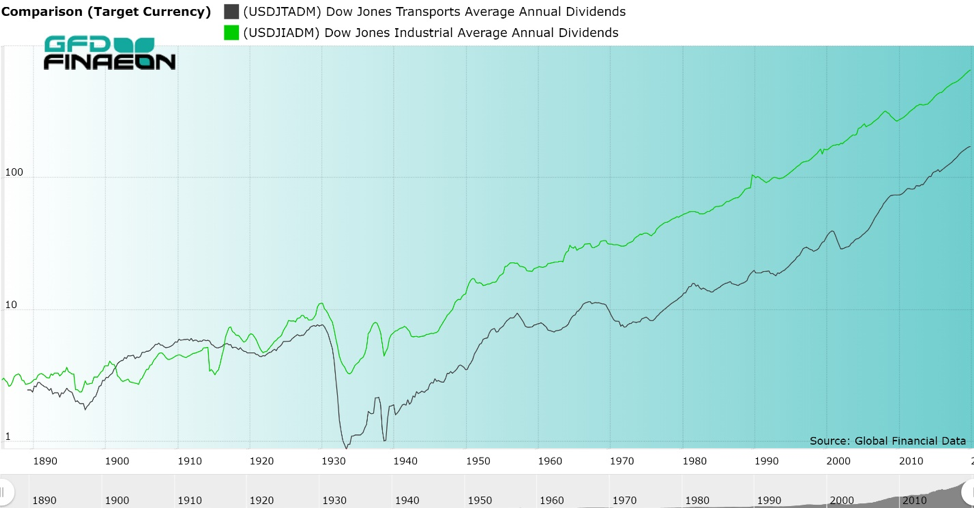 Figure 4. Annual Dividends Paid on the DJIA and DJTA, 1886 to 2020Results What did we find out from all of this work? We found that the Dow Jones Industrial Average outperformed the S&P 500 and the Dow Jones Transports but underperformed the GFD-100 Index. This is illustrated in Figure 5. On average, including dividends, the Dow Jones Industrial Average returned 10.26% per annum between May 1896 and May 2020. You can contrast this with returns of 8.43% to the Dow Jones Rail/Transport Average, 9.70% to the S&P Composite and 10.36% to the GFD-100 Index which includes the top 100 stocks in the United States each year regardless of its sector. The DJIA clearly beat the S&P Composite on a total return basis. The differences between the two indices is not significant, but it is interesting that over a 124-year period, the differences in the return between the 30 stocks in the DJIA and the 500 stocks in the S&P Composite would be so small, especially given the fact that one is an average of stock prices and the other is a cap-weighted index of stocks.
 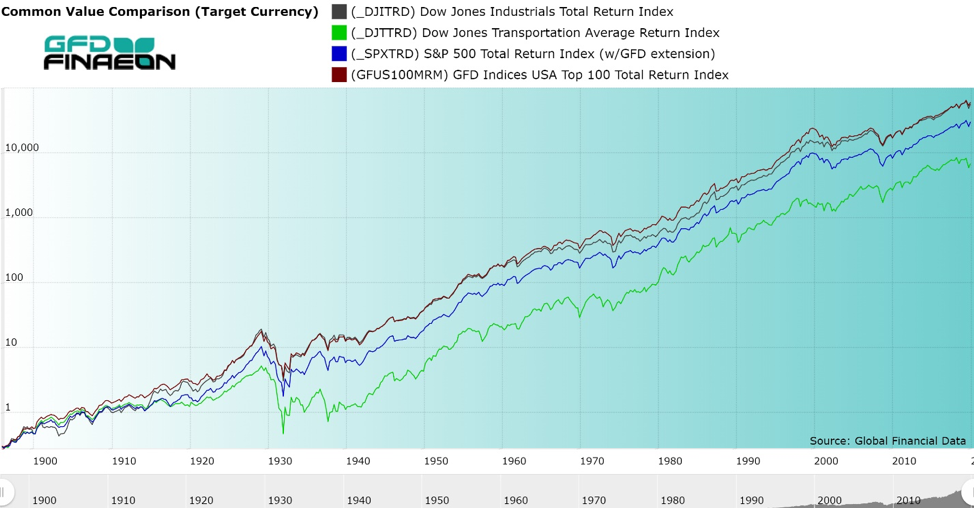 Figure 5. DJIA, DJTA, S&P Composite and GFD-100 Total Return Indices, 1896 to 2020 On the other hand, if you compare the DJIA and the Dow Jones Rails/Transports Average since 1889, as illustrated in Figure 6, you can see that the differences in the returns are significant. While the DJIA returned 10.26% per annum, the DJTA returned only 8.43% per annum. Obviously, the sector you choose makes a difference.
 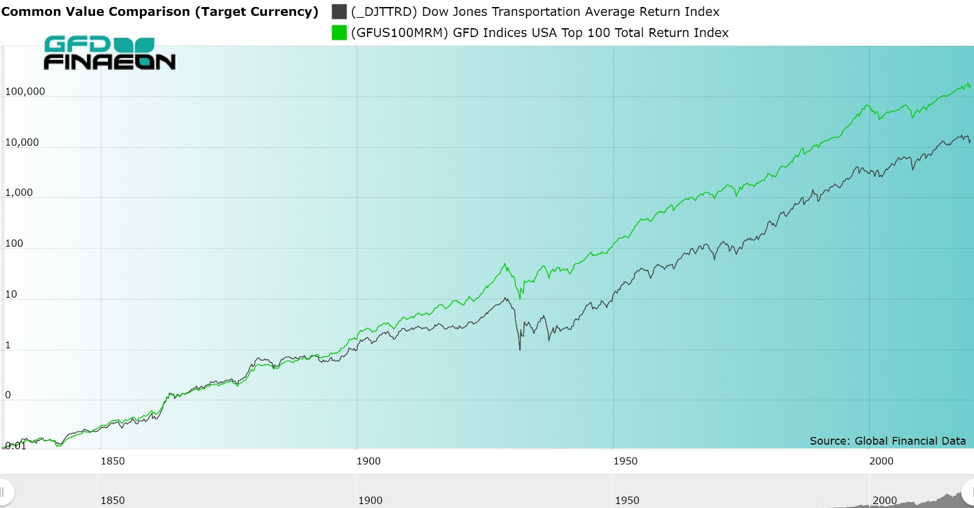 Figure 6. Dow Jones Transportation Average and GFD US-100 Index, 1832 to 2020 Conclusion Until now, no one has calculated the Dow Jones Transportation Average on a total return basis back to 1889. Although data for the price index has been around for 131 years, data on the total returns have only existed since 1987 when Dow Jones first started calculating a daily total return index for the Dow Jones Industrials, Transportation, Utilities and Composite Averages. Although the Averages began as relatively simple indices to calculate, simply adding up the prices of the components and then dividing by the number of stocks that were included in the Averages, the impact of changes in the components, stocks splits, different pars, stock distributions and other corporate actions has made a relatively simple task quite complex. Today, the impacts of all of these actions are included in the divisor which changes whenever there is a stock split or a change in the components of the Average. If you compare the returns to the DJIA, the S&P Composite and the GFD-100, they are remarkably similar, even though you are looking at returns over a period of almost 125 years. On the other hand, if you compare the returns to the Dow Jones Rails/Transports Average with the Dow Jones Industrials Average, the returns are significantly different. The lesson to be learned here is that sector is more important than size. US stocks have provided solid returns over the past 125 years and there is no reason to believe that this won’t continue to be true.
REQUEST A DEMO with a GFDFinaeon Specialist


