
 Financial markets have evolved over time. The relationship between stocks and bonds differed in each of the eras that Global Financial Data has created to differentiate the behavior of financial markets in the past: the Dutch East India Co. (1601-1692), the Glorious Revolution (1692-1720), Mercantilism (1720-1792) the Transportation Revolution (1792-1848), Free Trade (1848-1914), World War (1914-1945), Keynesianism (1945-1981) and Globalization (1981-). Bonds have primarily been used as a source of income with inflation and the risk of default affecting the price and yield on bonds. With stocks, on the other hand, higher earnings and dividends and thus capital gains have become the main driver of stock prices since higher earnings mean higher cash flows in the future to shareholders. The relative performance of stocks and bonds in the United Kingdom since 1700 is illustrated in Figure 1, which shows how this relationship has changed over time. As can be seen, there was a strong correlation between stocks and bonds during the Mercantilism of the 1700s. During the 1800s, the price of bonds generally rose, but slightly and showed little change over time. Equities, on the other hand, rose in price, first gradually during the Transportation Revolution, then strongly during the era of Free Trade between 1850 and 1914. As Figure 3 illustrates, there was almost an inverse correlation between stocks and bonds between 1914 and 1981. After World War II, the price of bonds fell as inflation rose, but equities rose in price both when there was little inflation before World War II and during the rising inflation that occurred after 1945. Since 1981, the correlation between stocks and bonds has been positive with the price of both stocks and bonds rising, bonds through falling inflation and quantitative easing, and stocks through higher profits. Let’s see how the relationship between stocks and bonds has evolved over time.
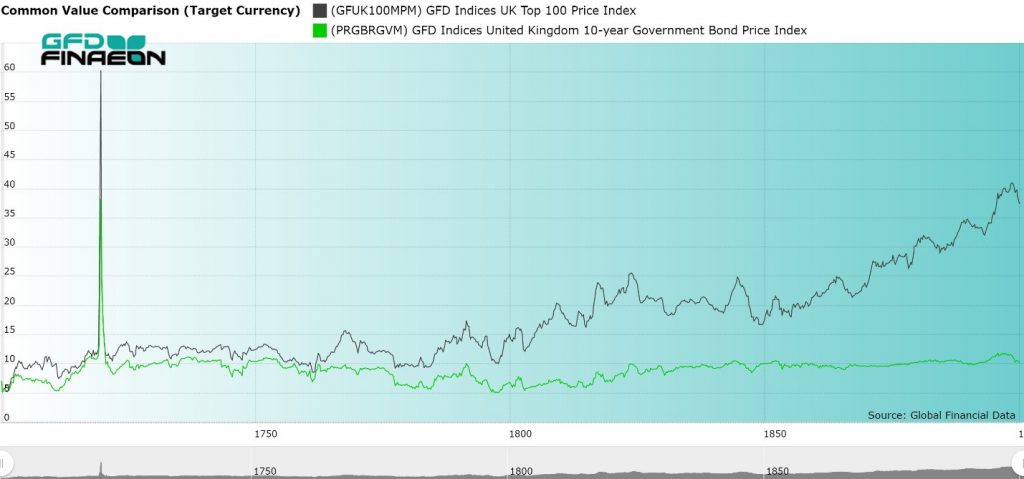
Figure 1. Stocks and Bonds in the United Kingdom, 1700 to 1900
Mercantilism (1720-1792)
Global Financial Data lacks information on the behavior of bonds in the 1600s and data on bonds in England only begins in the 1720s. During the period of Mercantilism (1720 to 1792), income was king. Just as today, bonds trade in parallel with each other, going up and down in price, with only small differences in the yields according to the risk of default, the same was true in the 1700s. During the eighteenth century, there were about two dozen securities that traded in Paris, London and Amsterdam. Most of the securities were bonds, but a few were international trading companies, such as the East India Company, which were backed by the central government of each country. In a way, virtually all of the liquid securities that were traded were government-backed securities which paid dividends or interest. Although the interest on bonds did not change, the dividends paid on individual securities did, though rarely. When the dividend changed, the price of the security responded so the yield stayed around 5%. If you look at Figure 1, you can see that stocks (black line) and bonds (green line) exhibited the same movements up and down, but stocks outperformed bonds over the course of the eighteenth century because of the greater risk to shareholders. In the United Kingdom, stocks returned 4.79% per annum while bonds returned 4.39% leaving an equity premium of 0.40%. During the 1700s, the amount of outstanding debt grew dramatically relative to equity. In 1692, the market capitalizations of stocks and bonds in the United Kingdom were each around £1 million, but by 1820, the British stock market had grown in size to £50 million and British government debt to £800 million. After the collapse of the South Sea and Mississippi Bubbles, investors preferred government bonds to equities. The 1700s were more a market for bonds than for stocks, but this would change in the 1800s.
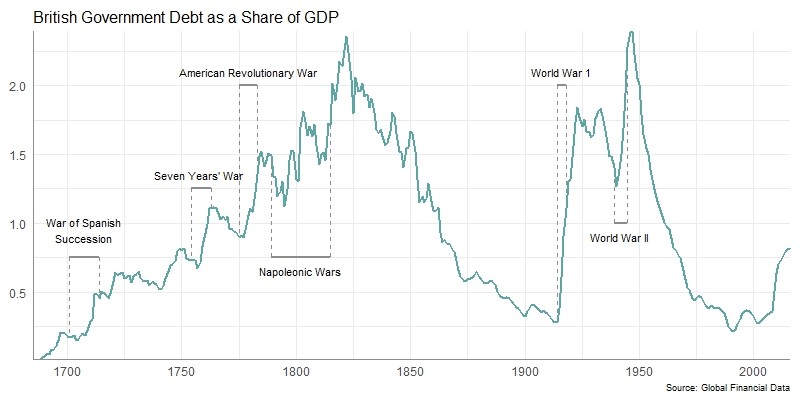
Figure 2. British Government Debt as a Share of GDP, 1692 to 2018
The Transportation Revolution (1792-1848)
The world went through a transportation revolution between 1792 and 1848, surviving the Napoleonic Wars that ravaged Europe between 1792 and 1815. There were four separate bubbles that occurred during those 56 years as investors found new stocks to speculate in. The stock market was revolutionized by the Canal Bubble of 1793 when dozens of canal stocks were issued leading to the first stock market bubble since the South Sea Bubble of 1720. Dozens of canals were approved to be built in the Midlands of Britain and some canals quadrupled in price as speculators rushed into the canals before their stock price collapsed back to par. 1792 was also the year when shares of the Bank of the United States started trading in Philadelphia, leading to a bubble in its shares, as speculators tried to corner its shares. The bubble ended quickly, but two new canal bubbles occurred between 1806 and 1810 and in the 1820s. In the mid-1820s money poured into South American stocks and bonds as investors tried to take advantage of resources in the newly independent countries. The Railway Mania of the 1840s led to a doubling in the value of transportation stocks in the United Kingdom before they collapsed after the bubble burst. Before 1800, each company only issued one security to shareholders, but in the 1840s, a single company could issue a dozen different classes of shares including partial shares, preferred shares, ordinary shares, deferred shares, bonds, and auxiliary shares. Each class was created to appeal to a particular group of individual investors. However, the railway mania crashed in 1848 as revolution swept through continental Europe. French and German stock markets both lost over 50% of their value during the crash of 1848. While stocks and bonds largely moved in parallel with each other before 1792, this did not occur during the Napoleonic War when companies in France and the Netherlands were closed and every country except the United Kingdom defaulted on their government bonds, either skipping interest payments or replacing old bonds with new bonds. Bondholders in France and the Netherlands lost two-thirds of their capital when sovereign debt was refinanced. In the United States, bondholders received three types of bonds in exchange for bonds issued during the Revolutionary War. South American governments issued bonds around 1820 only to default on them a few years later. Government bonds were certainly not risk free. The period between 1792 and 1848 was one of constant financial and economic innovation as investors had to deal with war between 1792 and 1815 and the financial revolution of canals and railroads after that. During those years, the United States endured a 50-year bear market and investors in London had to deal with speculative bubbles that drove stock prices up then down. Table 1 provides data on the returns to stocks, bonds, bills and inflation between 1792 and 1815 for the United States, the United Kingdom and the world. Stocks outperformed bonds in the United Kingdom, but not in the United States.
| Stocks | Bonds | Bills | Equity Premium | |
| UK | 5.63 | 4.54 | 4.58 | 1.04 |
| USA | 4.87 | 5.61 | 4.82 | -0.7 |
| World | 5.45 | 5.52 | 4.82 | -0.07 |
Table 1. Returns to Stocks, Bonds and Bills in USD, 1792 to 1848
Free Trade (1848-1914)
After the revolutions of 1848 failed, the world opened up to Free Trade. There were no major wars between 1848 and 1914, and government debt decreased as a share of GDP while the capitalization of the world’s stock markets grew dramatically as each country built railroads, canals, telegraphs, utilities and other infrastructure to integrate the global economy. Equities provided the opportunity for growth while bonds provided steady, reliable income. After 1815, the 1800s was a century of peace so the risk of default due to war by countries such as the United Kingdom, France or the Netherlands was almost nil. The yield on bonds fell to the 3% range in London and stayed there for most of the century. Bonds issued by emerging markets such as Greece, Portugal, Spain or South America, however, did run a risk of default, and emerging market government bonds were riskier than the blue-chip stocks that traded in London. Some governments missed interest payments for decades and had to refinance their debts imposing losses on investors. Equity prices made little progress between 1800 and 1850. Between 1850 and 1914, however, there were no bear markets in equities in the United Kingdom. Instead, stocks moved up in price as Figure 1 shows. Because British Consols had virtually no risk, they hardly changed in price. The coupon on Consols fell from 3% to 2.75% to 2.5% between 1881 and 1907. Consequently, stocks and bonds became separate types of securities and different asset classes. Bonds were purchased for income, and equities for capital gains. American railroads issued billions of dollars in stocks and bonds in New York, Amsterdam and London to pay for the railroads that crisscrossed America. Because the 1800s were a century of peace, the amount of outstanding British debt hardly changed and stayed at roughly £800 million throughout the century. As Figure 2 shows, the ratio of government debt to GDP fell in the United Kingdom as it did in the United States. Equities, however, grew in size dramatically. Stocks provided more of an opportunity for growth and their capitalization in the United Kingdom grew from £50 million to £700 million between 1815 and 1914. Meanwhile, the value of U.S. stocks grew from $20 million in 1792 to $20 billion in 1914, a phenomenal 1000-fold increase in stock market capitalization. The size of the US stock market increased another 1000-fold between 1914 and 2019 growing from $20 billion to $20 trillion. Will the US stock market increase another 1000-fold over the next 100 years? Table 2 provides data on the returns to stocks, bonds and bills between 1848 and 1914. As can be seen, returns to stocks and bonds varied dramatically between countries, with France and the United States providing the highest returns to stocks while the United Kingdom provided the smallest returns. Bonds actually outperformed stocks in the United Kingdom while the equity premium was around 3% in both the United States and in France.
| Stocks | Bonds | Bills | Equity Premium | |
| Belgium | 5.66 | 4.36 | 2.1 | 1.25 |
| France | 8.07 | 4.73 | 3.21 | 3.19 |
| Germany | 4.49 | 4 | 3.3 | 0.47 |
| UK | 2.6 | 2.69 | 3.2 | -0.09 |
| USA | 8.44 | 4.75 | 3.73 | 3.52 |
| World | 6.5 | 3.4 | 3.73 | 3 |
Table 2. Returns to Stocks, Bonds and Bills in USD, 1848 to 1914
World War (1914-1945)
Between 1914 and 1945, the world endured a thirty-year war in which Germany fought against France, Britain and the United States. The government heavily regulated the economy during World War I and World War II and the mismanagement of the economy by the Federal Reserve contributed to the depth of the Great Depression in the United States in the 1930s. Bond yields rose from 1914 until 1920 as the war generated inflation that drove interest rates higher. After 1920, interest rates declined, first through a lack of economic activity during the 1930s and through government regulation during World War II. Many governments defaulted on their bonds and waited until after World War II was over to come to terms with their creditors and issue new bonds to replace the old. The world had enjoyed a relatively open global economy of free trade until 1914, but when World War I began, stocks markets closed throughout the world. Governments went off the gold standard and introduced capital controls to limit the free flow of capital between countries. Attempts in the 1920s and 1930s to bring back the gold standard, free trade and the stability that marked the global economy before 1914 failed. By the 1930s, countries were seeking autarkic policies that relied upon government support and domestic production. International trade collapsed as war enveloped the world. The Federal Reserve was founded in 1913 and in 1914, World War I began leading to a large increase in the number of outstanding bonds as governments absorbed outstanding capital to pay for World War I and II. Between 1914 and 1945, there was great variety in the returns to stocks and bonds in different countries. Hyperinflation in the 1920s and defaults in the 1930s and 1940s wiped out many investors. While government bonds returned between four and five percent in most countries between the beginning of World War I and the end of World War II, equity returns varied tremendously. These returns are illustrated in Table 3. As the table shows, there is no correlation between the returns in different countries, reflecting the fact that capital could not easily flow between countries as it did before 1914. Countries that were not directly affected by the war, such as Australia, Canada and the United States provided high returns to shareholders while Germany provided a negative return. Countries that suffered from high inflation provided negative returns to bondholders in Belgium, Finland, France and Germany. Consequently, there was a wide variance in the equity premium, ranging from negative returns in Sweden and the United Kingdom to double digits in Germany as a result of hyperinflation reducing the return to fixed income investors.
| Stocks | Bonds | Bills | Equity Premium | |
| Australia | 8.5 | 4.07 | 1.5 | 4.26 |
| Belgium | 2.21 | -2.07 | -1.27 | 4.37 |
| Canada | 7.19 | 4.26 | 2.17 | 2.81 |
| Denmark | 3.05 | 4.9 | 4.19 | -1.76 |
| Finland | 5.12 | -2.85 | -4.53 | 5.12 |
| France | 3.55 | -13.59 | -4.29 | 6.59 |
| Germany | -0.02 | -1.05 | -53.19 | 15.7 |
| Japan | 2.32 | 4.38 | -2.45 | 3.41 |
| Netherlands | 5.18 | 3.38 | 2.5 | 0.77 |
| Sweden | 3.7 | 4.59 | 2.87 | -0.85 |
| Switzerland | 5.84 | 5.33 | 3.66 | 0.48 |
| UK | 3.51 | 3.93 | 2.07 | -0.4 |
| USA | 8.48 | 4.1 | 1.87 | 4.21 |
| World | 6.71 | 4.01 | 1.87 | 2.6 |
Table 3. Returns to Stocks, Bonds and Bills in USD, 1914 to 1945
Keynesianism (1945-1981)
After World War II concluded, the world wanted to avoid a return to the Great Depression of the 1930s. This led to attempts to micromanage the macroeconomy through Keynesian policies of government regulation, foreign exchange controls and the nationalization of key industries. At first these policies worked and the world was able to avoid a return to the Great Depression, but the cost was rising inflation and rising interest rates. Between 1950 and 1981, interest rates steadily rose in the United States and other countries, peaking in the US at 15.84% in 1981. Although the Federal Reserve was created to control inflation and thus interest rates, it failed in the 1970s as both inflation and interest rates rose to their highest levels in peacetime. Stocks were undervalued at the end of World War II since many investors feared that the economy would once again sink into depression, but instead, the creation of a system of global trade through the GATT allowed the economy to grow dramatically. European economies recovered from World War II, enjoying the fastest rates of growth in history, allowing stocks to rise in price, far exceeding the returns to bonds.
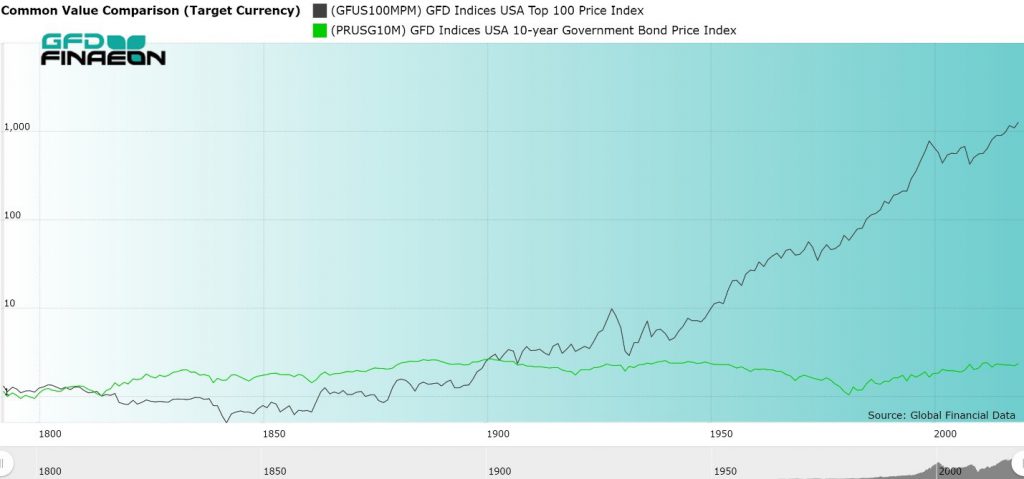
Figure 3. United States Stock and Bond Price Indices, 1792 to 2018
Stock prices rose in price between 1945 and 1981, though mainly in line with inflation. Between April 1901 and April 1982, there was virtually no change in the S&P 500 stock price index after adjusting for inflation. Between 1981 and 2018, on the other hand, the S&P 500 increased ten-fold after adjusting for inflation. Between 1792 and 1900, stocks and bonds provided similar returns with stocks declining in price between 1792 and 1848, then rising in price for the rest of the century. Bonds, on the other hand, steadily rose in price during the 1800s as bond yields declined. The real difference in performance came after World War II when stocks continually rose in price while bond yields rose causing bond prices to decline. As Table 4 illustrates, this situation created a high equity premium as stock returns rose and bond returns faltered. In 12 of the 15 markets GFD covers between 1945 and 1981, inflation exceeded the return to bonds making investors worse off after inflation. In France, Germany and Italy, inflation exceeded the return to bonds by over 6%. Holders of cash received negative returns after inflation in 11 of the 15 markets GFD covers. On the other hand, the world stock index provided a return of 10.26% with double-digit returns in five other countries. This created double-digit equity premia in Germany, Italy and Japan with the world equity premium equal to 8.52% and the equity premium in the United States equal to 7.38%. These results were driven by two concurring events: the recovery from World War II and the Great Depression and thirty years of rising interest rates. This was a perfect storm for the equity premium. Unfortunately, since investors lacked the history of four centuries of stock market performance that we now have, investors took this excessive excess premium as the norm. Since 1981, equities have continued to provide excess returns, but the decline in bond yields since 1981 has generated high returns to bonds, squeezing the equity premium.
| Stocks | Bonds | Bills | Equity Premium | |
| Australia | 11.41 | 3.22 | 3.18 | 8.19 |
| Belgium | 6.22 | 5.23 | 6.65 | 0.99 |
| Canada | 10.29 | 3.56 | 4.52 | 6.73 |
| Denmark | 8.61 | 5.97 | 6.54 | 2.64 |
| Finland | 7.97 | 1.02 | 4.3 | 6.95 |
| France | 4.1 | -1.91 | -0.95 | 6.01 |
| Germany | 10.4 | -2.74 | -4.55 | 13.14 |
| Italy | 5.55 | -2.91 | -0.58 | 15.01 |
| Japan | 12.1 | 0.5 | -1.28 | 11.6 |
| Netherlands | 8.66 | 3.27 | 3.88 | 7.25 |
| Spain | 4.17 | -1.46 | 0.46 | 5.63 |
| Sweden | 10.52 | 3.47 | 4.97 | 7.05 |
| Switzerland | 8.78 | 6.29 | 5.24 | 2.49 |
| UK | 4.38 | 1.2 | 3.63 | 3.18 |
| USA | 10.11 | 2.73 | 4.28 | 7.38 |
| World | 10.26 | 1.74 | 4.28 | 8.52 |
Table 4. Returns to Stocks, Bonds and Bills in USD, 1945 to 1981
Globalization (1981-)
High inflation, high interest rates, the OPEC oil crisis, stagflation and other problems led to large losses to investors in the 1970s. The Keynesian policies of macroeconomic management had clearly failed. When Paul Volcker was appointed chairman of the Federal Reserve in 1979, he reversed the policies of his predecessor to squeeze inflation out of the economy. As a result, inflation and interest rates have been declining for the past 38 years. Bondholders have profited immensely from the Fed’s policies since 1981. During the past 45 years, market exchange rates have replaced fixed exchange rates, capital has been free to flow to wherever investors can get the highest returns, Communism has fallen, China has opened up to the rest of the world, billions of people have moved out of poverty, governments have privatized firms they previously nationalized, technology has improved dramatically, thousands of new firms have introduced products that didn’t exist before, and the capitalization of the global stock market has grown dramatically. The result has been a win-win for investors as they have benefited from the globalization of world markets and the steady decline in bond yields which have generated capital gains for fixed-income investors. But this has come at a cost. Stock markets have been more volatile with the Crash of 1987 producing the largest single-day decline in history, and two vicious bear markets in 2000-2002 and 2007-2009 which each wiped out over half of the value of stock markets worldwide. During the past ten years, stock markets have bounced back and the S&P 500 and the World Index both now trade above where they were at in 2009. Table 5 shows how the high returns to fixed-income investors reduced the equity premium. Returns to stocks between 1981 and 2018 generally exceeded returns between 1945 and 1981. This was accompanied by lower inflation, but more importantly, dramatically higher returns to government bonds. In the United States, bond returns were 5% greater between 1981-2018 than 1945-1981 and 6% in the world as a whole. This reduced the global equity premium from 8.52% to 3.06%, and in four countries bonds generated a higher return than stocks. The equity premium fell in almost every country in the world.
| Stocks | Bonds | Bills | Equity Premium | |
| Australia | 11.41 | 8.98 | 5.81 | 0.44 |
| Belgium | 6.22 | 8.82 | 4.79 | 1.9 |
| Canada | 10.29 | 8.61 | 4.66 | -0.55 |
| Denmark | 8.61 | 10.36 | 6.69 | 2.11 |
| Finland | 7.97 | 8.73 | 5.13 | 5.03 |
| France | 4.1 | 9.06 | 4.85 | 1.96 |
| Germany | 10.4 | 7.73 | 5.19 | 3.8 |
| Italy | 5.55 | 9.09 | 5.5 | -3.21 |
| Japan | 12.1 | 6.74 | 3.76 | -0.86 |
| Netherlands | 8.66 | 8.1 | 4.4 | 2.25 |
| Spain | 4.17 | 8.7 | 4.99 | 1.65 |
| Sweden | 10.52 | 6.8 | 5.73 | 5.39 |
| Switzerland | 8.78 | 6.05 | 4.05 | 4.82 |
| UK | 4.38 | 8 | 4.54 | -1.08 |
| USA | 10.11 | 8.04 | 3.89 | 3.25 |
| World | 10.26 | 6.87 | 3.89 | 3.06 |
Table 5. Returns to Stocks, Bonds and Bills in USD, 1981 to 2018
Conclusion
Stocks and bonds have behaved differently in each of the historical eras of the past. During the period of Mercantilism (1720-1792), there was little difference in the behavior of stocks and bonds because both were backed by the central governments of each country. Equities emerged as a separate asset class during the Transportation Revolution (1792-1848) with bubbles in canals (1790s and 1810s), South American stocks (1820s), and railroads (1840s) driving the prices of stocks up before they crashed back down when the bubble burst. During the period of Free Trade (1848-1914), there were no global bear markets. There were periodic panics in 1857, 1870, 1893 and 1907, but equity markets recovered and continued to move upward until World War I began. Meanwhile, bond yields fell below 3% in the United Kingdom and other countries as capital was free to flow between countries. The period of the World Wars (1914-1945) saw capital restricted from flowing between countries as nations hoarded capital to pay for the two world wars. Since capital was not free to flow from one country to another, some countries suffered hyperinflation, and returns varied dramatically from one country to another. The principal problem was the default of many countries on their bonds. After World War II, during the period of Keynesian attempts to regulate the economy, the combination of recovering from World War II and rising interest rates generated high returns to equities, but low returns to government bonds. This widened the spread on returns to equities and bonds driving the equity risk premium to historically unprecedented levels. Since 1981, however, the reduction in government regulation of the economy, lower interest rates and the globalization of the international economy have provided immense benefits to investors. Both equities and bonds have provided high returns to investors who have benefitted no matter whether they chose to invest in stocks or in bonds. Today, however, investors face the threat of trade wars and currency wars which could reverse the period of growth and globalization that has prevailed during the past 40 years. Bond yields are at their lowest level in history, with most bond yields in Europe and Japan negative in nominal terms and negative in real terms in the rest of the developed world. If the equity premium remains within the 1%-3% range that it has registered over the past four centuries, this does not bode well for investors. It seems unlikely that either equities or bonds will provide high returns over the next decade. We can only hope that these fears of low returns are not realized and that politics doesn’t return the rising interest rates and government regulation that stymied investors between 1914 and 1981.
 The stock market declined 3% on August 14, 2019 because of the prospect that the yield curve was close to inverting between the 2-year note and the 10-year bond. Historically, when the yield on the 10-year bond has dipped below the yield on the 2-year bond, the inversion of interest rates portends a recession, and possibly a bear market in the near future. The yield on the 10-year bond is approaching 1.50% and could easily breach that level. The lowest yield the 10-year bond has ever been at is 1.37% which it reached in July 2016, but the yield could easily fall below that level soon.
The yield quickly bounced back after the July 2016 bottom, so it will be interesting to see whether interest rates remain low, as they did in 2012-2013, or bounce back as they did in 2016. Bond yields have been gradually declining since 1981 and there is no reason why they should have hit a permanent low. Yields below 1% are definitely possible given the low bond yields that prevail in Europe and Japan. The yield on the Swiss 10-year bond is currently below -1.00%.
Figure 1 provides a graph of the difference between the 10-year bond and 2-year note over the past 80 years with recessions overlaid to show that historically when the yield curve was inverted, a recession soon followed. But note that the recession didn’t begin until the yield curve became positive again.
The stock market declined 3% on August 14, 2019 because of the prospect that the yield curve was close to inverting between the 2-year note and the 10-year bond. Historically, when the yield on the 10-year bond has dipped below the yield on the 2-year bond, the inversion of interest rates portends a recession, and possibly a bear market in the near future. The yield on the 10-year bond is approaching 1.50% and could easily breach that level. The lowest yield the 10-year bond has ever been at is 1.37% which it reached in July 2016, but the yield could easily fall below that level soon.
The yield quickly bounced back after the July 2016 bottom, so it will be interesting to see whether interest rates remain low, as they did in 2012-2013, or bounce back as they did in 2016. Bond yields have been gradually declining since 1981 and there is no reason why they should have hit a permanent low. Yields below 1% are definitely possible given the low bond yields that prevail in Europe and Japan. The yield on the Swiss 10-year bond is currently below -1.00%.
Figure 1 provides a graph of the difference between the 10-year bond and 2-year note over the past 80 years with recessions overlaid to show that historically when the yield curve was inverted, a recession soon followed. But note that the recession didn’t begin until the yield curve became positive again.
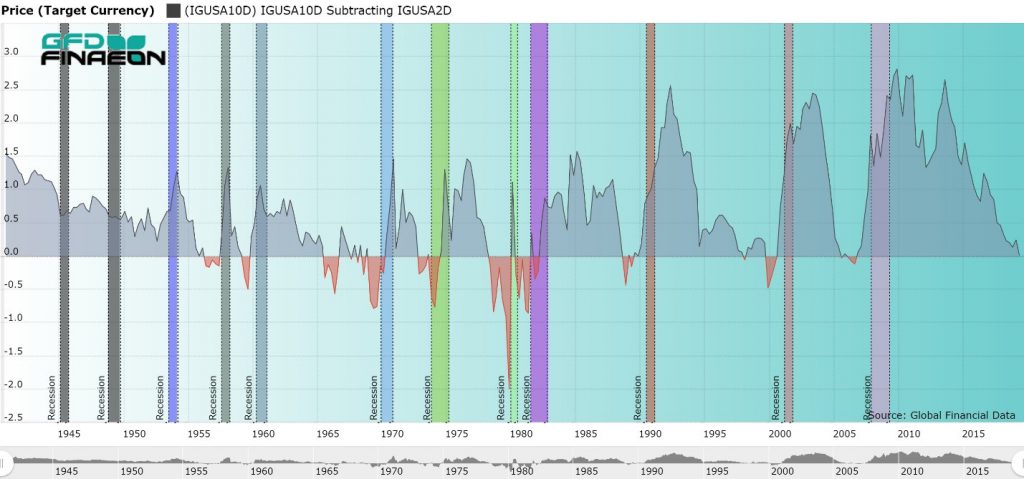
Figure 1. USA 10- and 2-year Government Bond Spread and Recessions
As can be seen, each of the recessions since 1950 were preceded by periods when the yield on the 2-year note exceeded the yield on the 10-year bond. There was one case where no recession followed, in 1965 and 1966, but with that one exception, every dip into a negative yield spread in the past was followed by a recession within a year. During the 1930s and 1940s, short-term interest rates were kept artificially low because of the Great Depression in the 1930s and World War II in the 1940s. If you go back to the 1920s, however, you can see that both the 1920-1921 recession and the 1929-1932 Depression were preceded by yield-curve inversions. Moreover, seven of the nine bear markets since 1950 were preceded by a yield inversion. The 1962 Steel Crisis and the 1987 Stock Market Crash were not preceded by a yield inversion, and no bear market followed the 1969 inversion. Given the evidence, the yield inversion between the 2-year note and 10-year bond is not a perfect indicator of future recessions and bear markets. However, over 80% of the time it does prove to be an accurate indicator. The yield started to invert earlier this year, and has slowly spread through the curve. The yield on the 30-year bond, at 1.98% is below 2% for the first time in history. The yield on the 30-year bond fell below the yield on the 2-year bond in 1989, 2000 and 2006, and could still fall below it later this year. The United States has gone ten years without the economy either falling into a recession or into a bear market. So certainly, by the law of averages, a recession or bear market in the near future is likely. The yield on the 10-year bond has not fallen below the yield on the 2-year note yet, but could soon. With an election coming up next year, it seems unlikely that politicians would allow a recession to occur during the next year, but since the last recession and bear market began right before the 2008 election, this is possible. Whether this occurs, only time will tell. Bear markets are clearly defined: a decline of 20% or more in an equity market constitutes a bear market. By this definition, the United States had 18 bear markets in the 1900s. But what is a bull market? Global Financial Data (GFD) has supplemented the definition of a bear market with the requirement that the intervening gain should show a rise of at least 50% before the 20% decline sets in. Otherwise, successive declines without a bounce back could be treated as multiple bear markets when actually there was only one long, extended bear market.
But what about fixed income markets? They go through bull and bear markets just like equity markets, but there is no definition of what would define a bull or bear market in fixed income markets. So let’s see if we can come up with rules for defining bull and bear markets in fixed-income markets. There are several facts that need to be considered.
Bear markets are clearly defined: a decline of 20% or more in an equity market constitutes a bear market. By this definition, the United States had 18 bear markets in the 1900s. But what is a bull market? Global Financial Data (GFD) has supplemented the definition of a bear market with the requirement that the intervening gain should show a rise of at least 50% before the 20% decline sets in. Otherwise, successive declines without a bounce back could be treated as multiple bear markets when actually there was only one long, extended bear market.
But what about fixed income markets? They go through bull and bear markets just like equity markets, but there is no definition of what would define a bull or bear market in fixed income markets. So let’s see if we can come up with rules for defining bull and bear markets in fixed-income markets. There are several facts that need to be considered.
Bull and Bear Fixed Income Cycles
First, there is a greater correlation between individual fixed income instruments than between individual equities. If interest rate yields rise on a particular day and bond prices fall, almost all bond prices will fall. In bond markets, you lack the dispersal of advances and declines that occur in the equity markets. Over time, risk spreads between different bonds will rise and fall. During a recession when the risk of default increases on low quality bonds, the yield difference between AAA and BB bonds widens, but during a strong market, this difference shrinks. Maturity also influences relative interest rates. As is well known, the yield curve which measures the spread between short-term and long-term bonds, is usually positive. However, as the economy approaches a recession, short-term yields can exceed long-term yields and act as an indicator of a pending recession. Second, bull and bear markets are generally longer for fixed income instruments than for equities. The reason for this is that three things generally drive interest rates: risk of default, maturity and inflation. Equities, on the other hand, are typically driven by anticipated future earnings. When a recession is looming and investors anticipate that future earnings will decline, shares can decline in price quickly. When the recession is over and earnings return, the price of equities can rise dramatically. There were 18 bear markets in the United States in the 1900s, meaning that one occurred every five or six years. However, if you look at bond yields, the rises and falls in the yield on the 10-year bond stretches over longer time periods. Bond yields fell from the 1780s to 1830s, rose until the Civil War in the 1860s, declined to around 1900, rose until 1920, declined to 1950, rose to 1981 and have declined steadily since then. Bull and bear markets in equities may last around 6 years, but bull and bear markets in fixed income markets last 40 or 50 years. The current rise and fall began in 1945 and has lasted almost 75 years. Bond yields have been declining since 1981 and there is no evidence that they have hit their bottom. Bond yields are negative in some European countries and there is no guarantee that bond yields couldn’t also turn negative in the United States at some point in the future. Bond yields could theoretically remain low or continue their decline for another decade. Risk and reward work in opposite directions for short-term and long-term fixed-income investors. For short-term holders of Treasury Bills, there is virtually no default risk, but there is reinvestment risk. When interest rates are rising, this works to the advantage of investors who are likely to receive a higher return when they reinvest their money after the 3-month T-bills mature. When short-term yields are falling, investors will receive a lower return when they reinvest their money. On the other hand, rising bond yields mean lower bond prices, reducing the return to investors. Hence, a bull market for short-term holders of T-bills is a bear market for long-term holders of 10-year Treasury Bonds. Figure 1 compares the yield on the 10-year Government bond with the yield on 3-month Treasury Bills over the past 100 years. Short-term yields are usually less than long-term yields. The long-term pattern of rising and falling yields over a period of several decades is visible. In addition to this, it can be seen that short-term rates are more volatile than long-term rates, rising above long-term rates as a prelude to a recession and plunging below long-term rates once the economy recovers.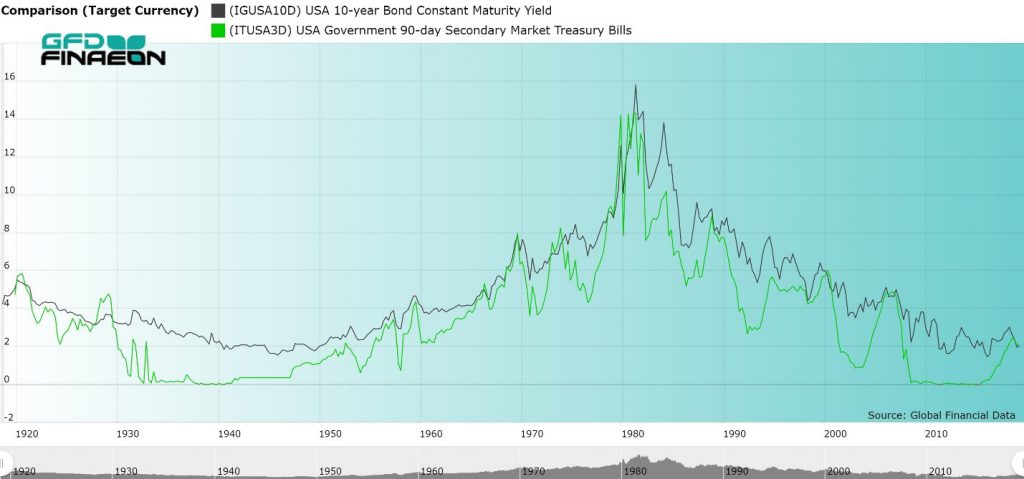
Figure 1. Yields on 10-year Bonds and 3-month T-bills, 1919 to 2019
Although there have been only two bull and bear markets in 10-year bonds over the past 100 years, there have been 17 bull and bear markets in 3-month Treasury Bills over the past 100 years. But how would you define a bull and bear market in Treasury bills? We say that in order for there to be a bull or bear markets, you need to have at least a 200-basis point move up or down in the yield. Although 10-year bond yields have been in a downward trend since 1981, there have been dramatic moves up and down in the yield over time. If you were to limit yourself to 200-basis point moves in the 10-year bond, you would find that there have been six bear markets in 10-year bond yields since 1981, not one. Unfortunately, this definition might have limited usefulness in the future. With bond yields falling below 2% in recent years, it would be difficult to sustain a 200-basis point move. Table 1 provides the broad moves in 3-month Treasury Bills over the past century. Generally, a bull-bear market cycle in yields occurred about every five years, which is mainly a reflection of recessions occurring about every five years. Since 2000, however, the time required for the market to move through one of its bull-bear market cycles has increased to around 10 years.| Date | Yield | Decline | Date | Yield | Increase |
| 12/31/1920 | 5.875 | 5.875 | |||
| 8/31/1924 | 1.9 | 3.975 | 5/31/1929 | 5.09 | 3.19 |
| 7/31/1931 | 0.41 | 4.68 | 1/31/1932 | 2.681 | 2.271 |
| 12/31/1932 | 0.085 | 2.596 | 3/31/1933 | 2.289 | 2.204 |
| 1/5/1940 | 0 | 2.29 | 5/8/1953 | 2.29 | 2.2899 |
| 6/7/1954 | 0.61 | 1.68 | 10/16/1957 | 3.67 | 3.06 |
| 5/27/1958 | 0.55 | 3.12 | 1/6/1960 | 4.68 | 4.13 |
| 7/1/1960 | 2.05 | 2.63 | 9/21/1966 | 5.59 | 3.54 |
| 6/23/1967 | 3.33 | 2.26 | 12/29/1969 | 8.08 | 4.75 |
| 2/11/1972 | 2.99 | 5.09 | 8/23/1974 | 9.74 | 6.75 |
| 12/20/1976 | 4.24 | 5.5 | 3/25/1980 | 16 | 11.76 |
| 6/13/1980 | 6.18 | 9.82 | 12/11/1980 | 17.14 | 10.96 |
| 8/20/1982 | 7.08 | 10.06 | 8/27/1984 | 10.67 | 3.59 |
| 10/8/1986 | 5.04 | 5.63 | 3/27/1989 | 9.1 | 4.06 |
| 10/1/1992 | 2.61 | 6.49 | 2/1/1995 | 5.9 | 3.29 |
| 10/16/1998 | 3.56 | 2.34 | 11/6/2000 | 6.24 | 2.68 |
| 6/19/2003 | 0.8 | 5.44 | 2/20/2007 | 5.05 | 4.25 |
| 9/22/2011 | 0 | 5.05 | 3/21/2019 | 2.49 | 2.49 |
Table 1. Bull and Bear Market Cycles in 3-month U.S. Treasury Bills
The historical record on yield cycles for 10-year Treasury Bonds is provided in Table 2. As can be seen, the time cycles are longer than the 3-month cycles and the definition of a cycle depends upon the definition of how much of a move is required to define a bull-bear market cycle. There hasn’t been a 200-basis move up since the 2007 Great Recession occurred. And again, the move up from 1945 to 1981 could be defined as one long, extended increase in interest rates and the move since 1981 as one long move down. Moreover, there is no guarantee that interest rates have bottomed out and a new bear market in the price of 10-year bonds has begun. The yield on 10-year bonds has turned negative in both Europe and Japan and there is no reason why the same couldn’t happen in the United States. Only time will tell whether 2% moves up and down lie in our future.| Date | Yield | Decline | Date | Yield | Increase |
| 03/31/1788 | 24.615 | ||||
| 01/31/1792 | 3.956 | 20.659 | 09/30/1798 | 7.059 | 3.103 |
| 07/31/1802 | 4.511 | 2.548 | 10/31/1814 | 5.882 | 1.371 |
| 09/30/1832 | 2.996 | 2.886 | 05/31/1861 | 7.059 | 4.063 |
| 3/31/1902 | 2.86 | 4.199 | 8/30/1920 | 5.67 | 2.81 |
| 11/30/1945 | 1.55 | 4.12 | 10/31/1957 | 3.97 | 2.42 |
| 4/30/1958 | 2.88 | 1.09 | 8/7/1975 | 8.48 | 5.6 |
| 12/30/1976 | 6.8 | 1.68 | 2/26/1980 | 13.65 | 6.85 |
| 6/16/1980 | 9.47 | 4.18 | 9/30/1981 | 15.84 | 6.37 |
| 5/4/1983 | 10.12 | 5.72 | 5/30/1984 | 13.99 | 3.87 |
| 8/29/1986 | 6.95 | 7.04 | 10/16/1987 | 10.23 | 3.28 |
| 10/15/1993 | 5.19 | 5.04 | 11/7/1994 | 8.05 | 2.86 |
| 12/10/1998 | 4.53 | 3.52 | 1/20/2000 | 6.79 | 2.26 |
| 6/13/2003 | 3.13 | 3.66 | 6/12/2007 | 5.26 | 2.13 |
| 12/18/2008 | 2.08 | 3.18 | 4/5/2010 | 4.01 | 1.93 |
| 7/25/2012 | 1.43 | 2.58 | 12/31/2013 | 3.04 | 1.61 |
| 7/5/2016 | 1.37 | 1.67 | 11/8/2018 | 3.24 | 1.87 |
Table 2. Bull and Bear Market Cycles in U.S. 10-year Treasury Bonds
