

At about $1 trillion, Brazil’s stock market is among the twenty largest stock markets in the world, equal to about half of the country’s GDP. The first stock exchange opened in Brazil in 1817, the Rio de Janeiro Stock Exchange opened in 1820, and the Sao Paulo Stock Exchange opened in 1890. Brazilian stocks began listing in London in 1825 when three Brazilian mining companies took advantage of London’s interest in South America to list their shares. Between 1825 and 1985, 65 Brazilian companies listed in London.
Despite this long history, Brazil is an emerging market for which it is difficult to provide an accurate, long-term stock index because of the inflation that wrecked the economy in the late 1900s. Between 1967 and 1994, Brazil went through five currencies and inflation averaged over 182% per annum, with inflation exceeding 1000% each year between 1988 and 1994. In February 1990, interest rates hit a daily rate of 3.626%, which works out to over 790,000% per annum. The debt market for bonds and bills became almost non-existent. Brazil was finally able to tame its inflation addiction in 1994 when it replaced the Cruzeiro with the Real. As a result of decades of inflation, it took 2.75 quintillion (2,750,000,000,000,000,000) reis of the 1800s to obtain 1 real of money today. Even since the currency was stabilized in 1994, the stock market has continued on a roller coaster ride. How could an economy or stock market function under such circumstances?
Brazilian stock index data is available since 1954 when the SN Index which used companies from both the Rio de Janeiro and Sao Paulo stock exchanges was introduced. An index for Rio began in 1955 and the Bovespa index from Sao Paulo starts in 1968. Since Brazilian stocks have traded on the London Stock Exchange since 1825, we can calculate an index of London shares and append this index onto the Bovespa to create an index of Brazilian shares that stretches from 1825 until today.
Among the more prominent Brazilian companies that listed in London were the Brazilian Traction, Light and Power Co. (later renamed Brascan), which existed between 1912 and 1997, the General Mining Association, which existed between 1825 and 1900, the Rio de Janeiro City Improvement Co, which listed from 1862 to 1930, the Sao Paulo Railway Co, which existed between 1883 and 1969, the St. John d’El Rey Mining Co. which listed in London between 1830 and 1969, and the Leopoldina Railway Co. which listed between 1899 and 1952 and inherited railway lines that converged on Rio De Janeiro.
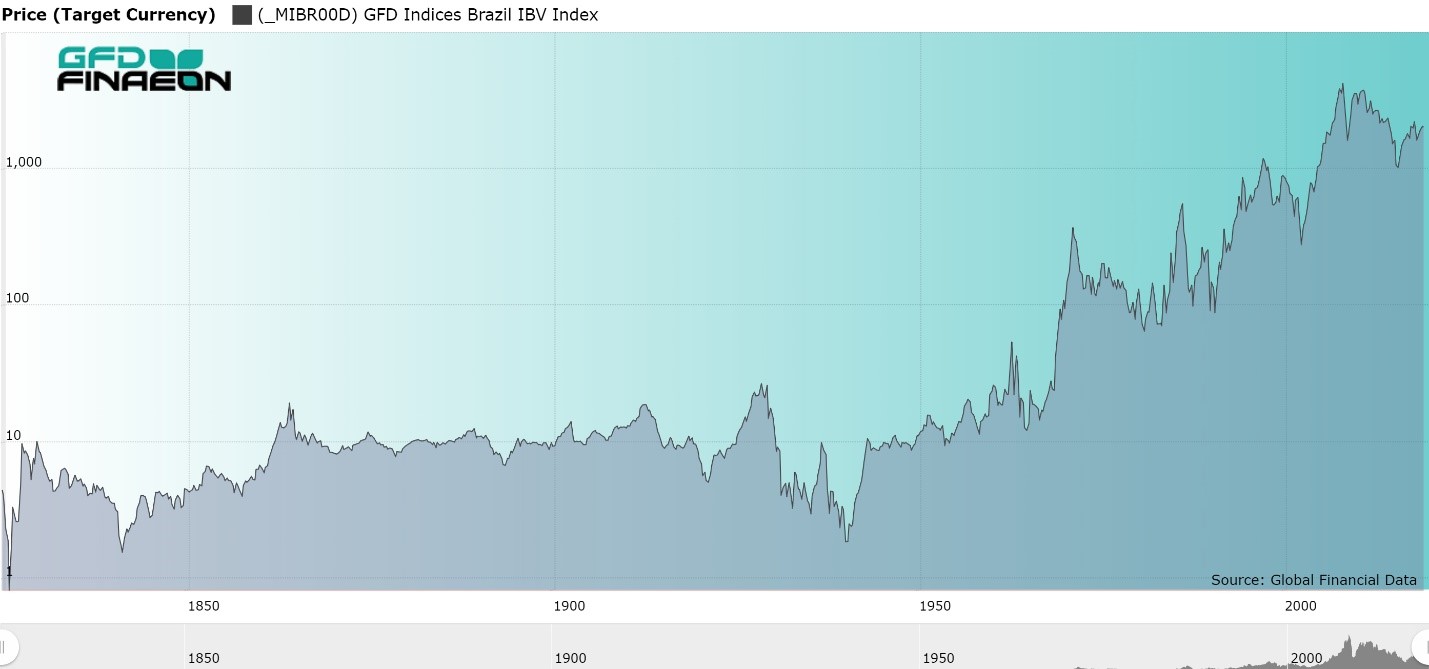
Figure 1. Brazil Stock Price Index, 1825 to 2018 in US Dollars
As Figure 1 shows, Brazilian stocks made little progress until the 1950s. There was little capital appreciation in Brazilian stocks between the 1830s and 1940s, and in some ways, this result was not unexpected. Between the 1820s and 1940s, the index relies upon Brazilian stocks that were listed in London. Brazilian stocks that listed in London provided a total return of 7.13% of which 1.50% came from capital gains and 5.6% came from dividends between 1825 and 1950. Without the dividends, investors would have received little in return from their investment in Brazil. By contrast, between 1824 and 1968, Brazilian government bonds returned 5.81% in USD while Brazilian stocks returned 7.28% providing an equity premium of 2.07%.
It is difficult to measure the long-term equity risk premium after 1968 because no risk-free instrument existed in Brazil’s hyperinflationary environment. With interest rates exceeding 3.6% per day or 790,000% per annum, you might not question whether you are going to get some money back, the only question is how much? No long-term bonds existed between 1968 and the 1990s when U.S. Dollar Brady Bonds were introduced. Real-based bonds were introduced in the 2000s. Consequently, you can calculate the equity risk premium before 1968 and after 1994, but not during the period of hyperinflation.
If you can’t even predict the inflation rate over the next month, how can you predict the inflation rate, and thus the yield on bonds, over a five- or ten-year period? Consequently, there are no benchmarks to compare the return on stocks to any other asset. The whole economy is wrapped up in avoiding inflation. Dividends lose their meaning in a world of 1000% inflation so the total return index differs little from the price index. Before 1994, the dividend yield in Brazil was usually under 1% as inflation quickly wiped out any increases in dividends. Inflation creates problems that investors in non-inflationary countries never have to think about. If you look at returns to investors in a country such as the United States which rarely has had high inflation rates, you can see how returns after inflation sink when inflation hits double digits. What would happen if inflation hit quadruple digits?
We can measure the equity risk premium between 1993 and 2018 using the MSCI Brazil Index and the EMBI U.S. Dollar Bond Index. As measured in U.S. Dollars, between 1993 and 2018, a bond investor would have received a 10.43% annual return while a stock investor would have received a 10.19% annual return. Brazilian government bonds outperformed stocks during the past 25 years. These returns are summarized in Table 1.’
| Equities | Equities | Bonds | ERP | |
| Price | Return | Return | ||
| 1825-1950 | 1.5 | 7.28 | 5.81 | 2.07 |
| 1950-1994 | 9.75 | |||
| 1994-2018 | 6.04 | 10.19 | 10.43 | -0.24 |
| 1825-2018 | 3.42 |
Table 1. Brazil Annual Equity and Bond Returns in U.S. Dollars, 1825-2018
The historical data for Brazil can either be adjusted for inflation, or converted into U.S. Dollars to eliminate the impact of Brazil’s hyperinflation, but because changes in the inflation rate and changes in the exchange rate differ from changes in the stock index, measuring bull and bear markets is difficult. When the inflation rate is 1000% and you are looking for a 20% decline in the index to register a bear market, any misalignment between the stock index and the exchange rate can produce a bear market in U.S. Dollars that didn’t occur in Brazilian Reais or Cruzeiros.
There are periods of rapid growth in Brazilian stock prices followed by a decade or more of no progress in the price of stocks in U.S. Dollars. It is interesting to note that between 1971 and 1993, the worst period of hyperinflation in Brazil’s history, despite prices rising a trillion-fold in Cruzeiros, the stock index made almost no progress in nominal US Dollars.
Even after you convert Brazilian stock prices into US Dollars, the market has gone through wild fluctuations. The stock market increased in price 20-fold between 1966 and 1971 generating an 82% annual return, but the index was at the same level 22 years later in 1993 as it had been at in 1971. The market increased 40-fold between 1990 and 2007 generating a 25% annual rate of return. However, since 2007, the Brazilian stock market has lost half of its value. At its bottom in 2016, the market was no higher than it had been in 1997. There is nothing new in this volatility. Between 1929 and 1939, the Brazilian stock market lost 90% of its value providing one of the worst returns in the world during the Great Depression.
Ride the Bull, but Get Off After That
The main conclusion you can make from all of this evidence is that Brazil is not a buy-and-hold market because it is a roller coaster with periods of tremendous gains followed by periods of a decade or more in which the stock market makes no progress. In short, Brazil is a place for market timers, and very adept market timers at that. If your timing is off, you will pay the price. In 2008 during the financial crisis, the Brazilian market declined by over 73%. In 2019, the stock market is at the same place it was at in 2006.
This is the basic problem with most emerging markets. Because of their uncertain political environment, they have an uncertain economic environment. Investors rush in when it looks like the country has changed and is ready to adopt and apply the tenants of free markets and open trade, but when things go awry, the country can linger in the doldrums for a decade or more. Nevertheless, over time the good periods of high returns in Brazil have more than offset the decade or two of low returns. While the S&P 500 returned 9.07% per annum between 1993 and 2018, Brazilian stocks returned 10.19% and bonds 10.43%. Whether that extra return is worth the extra volatility it entails is up to the individual investor. Most investors would rather avoid the risk, but if you can catch the next meteoric rise in Brazilian stocks, you will be rewarded.
25 years ago: June 1994
S&P 500: 444.27 (vs. 2826.15 in 06/2019)
10-year U.S. Government Bond Yield: 7.34% (vs. 2.12% in 06/2019)
Gold: $388.25 (vs. $1324.25 in 06/2019)
Oil: $19.365 (vs. $53.50 in 06/2019)
GBP/USD: 1.544 (vs. 1.264 in 06/2019)
US GDP: $7,246 billion (vs. $21,062 billion in 03/2019)
US Population: 260 million (vs. 328 million in 2019)
06/12/1994: Nicole Brown Simpson and Ronald Goldman are murdered outside her home in Los Angeles, California. O.J. Simpson is later acquitted of the killings, but is held liable in a wrongful death civil suit.
06/13/1994: A jury in Anchorage, Alaska, blames recklessness by Exxon and Captain Joseph Hazelwood for the Exxon Valdez disaster, allowing victims of the oil spill to seek $15 billion in damages.
06/14/1994: The1994 Stanley Cup riot occurs after the New York Rangers win the Stanley Cup from Vancouver, causing an estimated CA$1.1 million, leading to 200 arrests and injuries.
06/21/1994: Amid talks of a trade war, the dollar falls to a post-World War II low against the yen, breaking below the level of 100 yen to the dollar at one point.
06/28/1994: The White House announces plans to re-establish a refugee camp at Guantanamo Bay, Cuba as waves of refugees desperately try to escape Haiti by any means. Members of the Aum Shinrikyo cult release sarin gas in Matsumoto, Japan; Seven people are killed, 660 injured.
50 years ago: June 1969 S&P 500: 97.71 (vs. 2826.15 in 06/2019) 10-year U.S. Government Bond Yield: 6.73% (vs. 2.12% in 06/2019) Gold: $41.20 (vs. $1324.25 in 06/2019) Oil: $3.21 (vs. $53.50 in 06/2019) GBP/USD: 2.3908 (vs. 1.264 in 06/2019) US GDP: $1,009 billion (vs. $21,062 billion in 03/2019) US Population: 205 million (vs. 328 million in 2019) 06/03/1969: Melbourne Evans collision: off the coast of South Vietnam, the Australian aircraft carrier HMAS Melbourne cuts the U.S. Navy destroyer USS Frank E. Evans in half. 06/12/1969: Credit clamps tightened. All three Dow Averages hit new lows for year. 06/19/1969: NYSE appropriated $7.5 million for future automation projects; computerized routing of odd-lot orders from brokerage houses to trading floor and expansion of Exchange's market-data system, which drives stock ticker. 06/20/1969: Georges Pompidou began his term as president of France. Jacques Chaban-Delmas (Union for Democratics for the Republic) became Prime Minister of France 06/22/1969: The Cuyahoga River catches fire in Cleveland, Ohio, drawing national attention to water pollution, and spurring the passing of the Clean Water Act and the creation of the Environmental Protection Agency. 06/23/1969: IBM announced that effective January 1970 it would price its software and services separately from hardware thus creating the modern software industry. 06/28/1969: Stonewall Riots begin in New York City, marking the start of the Gay Rights Movement.
100 years ago: June 1919 S&P 500: 8.95 (vs. 2826.15 in 06/2019) 10-year U.S. Government Bond Yield: 4.69% (vs. 2.12% in 06/2019) Gold: $20.67 (vs. $1324.25 in 06/2019) Oil: $4.06 (vs. $53.50 in 06/2019) GBP/USD: 4.59 (vs. 1.264 in 06/2019) US GDP: $84 billion (vs. $21,062 billion in 03/2019) US Population: 104 million (vs. 328 million in 2019) 06/01/1919: Paris Peace Conference, 1919: Albania was divided between Greece, Italy and Yugoslavia at the conference, which did not admit Albanian representation. 06/02/1919: Anarchists simultaneously set off bombs in eight separate U.S. cities. 06/04/1919: The U.S. Congress approves the19th Amendment to the United States Constitution, which guarantees suffrage to women, and sends it to the U.S. states for ratification. 06/11/1919: Sir Barton wins the Belmont Stakes, becoming the first horse to win the Triple Crown. 06/15/1919: John Alcock and Arthur Brown complete the first non-stop transatlantic flight when they reach Clifden County Galway, Ireland. 06/18/1919: Germany given ultimatum to sign Treaty of Versailles. 06/23/1919: Estonian War of Independence: the decisive defeat of the Baltische Landeswehr in the Battle of Cesis. This day is celebrated as Victory Day in Estonia. 06/28/1919: The Treaty of Versailles is signed in Paris, bringing fighting to an end in between Germany and the Allies of World War I.
200 years ago: June 1819 S&P 500: 1.513 (vs. 2826.15 in 06/2019) 10-year U.S. Government Bond Yield: 4.84% (vs. 2.12% in 06/2019) Gold: $19.39 (vs. $1324.25 in 06/2019) GBP/USD: 4.506 (vs. 1.264 in 06/2019) US GDP: $727 million (vs. $21,062 billion in 03/2019) US Population: 9.379 million (vs. 328 million in 2019) 06/12/1819: Manuel Gonzalez Salmon y Gomez de Torres became Prime Minister of Spain 06/20/1819: The U.S. vessel SS Savannah arrives at Liverpool, United Kingdom. It is the first steam-propelled vessel to cross the Atlantic, although most of the journey is made under sail. 06/23/1819: Radical political reform meetings in Great Britain. © 2019 Global Financial Data. Please feel free to redistribute this Events-in-Time Chronology and credit Global Financial Data as the source.
GFD has calculated a global index of stocks that begins in 1602 and continues until the present. With this index, we can track the changes in global stock markets over the past 400 years. In particular, we can determine when bear markets occurred and study the causes of those bear markets.
The number of stocks used in the index has grown over time. Data from the 1600s is based upon the data for only one stock, the Dutch West India Co., so any analysis of bear markets during the seventeenth century would only look at the behavior of one stock, not of the global market. There is virtually no data from Amsterdam between 1692 and 1720, and data from Paris begins in 1718. Between 1692 and 1718, almost all of the data comes from London. For most of the 1700s, the index relies upon six companies from London, Paris and Amsterdam, and the analysis below relies upon the behavior of those companies. Only in the 1800s did the number of stock markets and companies increase to hundreds of companies.
We have already shown that you can divide up the history of equity markets into four eras: the period of Mercantilism (1600-1799) during which a few international trade companies dominated markets, Free Trade (1800-1914) during which railroads and other industries allowed stock markets to increase in size dramatically, Regulation (1914-1981) during which government regulation and nationalizations restricted the growth of global stock markets, and Globalization (1981-) during which markets once again became a source of capital for global corporations.
By number, there were five global bear markets in the 1700s, four bear markets in the 1800s, seven bear markets in the 1900s and so far, two bear markets in the 2000s. This gives us a total of 18 bear markets over the past 417 Years. GFD defines a bear market as a 20% decline in the price of stocks following a bull market in which prices increase by at least 50%. The index is in British Pounds until 1792 and in U.S. Dollars after 1792.
The worst bear market in global history was the crash that followed the Mississippi/South Sea Bubble in 1719 during which the world index fell 89%. The second worst decline in the history of the stock market was the 1929 crash in which the world index fell 80%. Besides these two bear markets, there have been only two cases where the global market lost more than half of its value. This occurred during the 1846-1848 bear market and during the 2007-2009 financial crash. Will this volatility continue?
Bear Markets in the 1700s
There were five bear markets in the 1700s, in 1700-1701 (a decline of 36%), in 1704-1712 (a decline of 40%), 1719-1762 (a decline of 89%), 1768-1784 (a decline of 37%, and between 1792 and 1797 (a decline of 41%). There was also a bear market between 1688 and 1696 during which the market declined 46%. What caused each of these bear markets?
The Nine Years’ War Bear Market
The first two bear markets are illustrated in Figure 1 which looks at the World Index between 1686 and 1705. The four bear markets between 1688 and 1720 were driven by the two European wars between France and the Allies. The Nine Years’ War occurred between 1688 and 1697 and the War of the Spanish Succession occurred between 1701 and 1714.
1688 and 1689 were also the years of the Glorious Revolution in Britain when William and Mary were declared the King and Queen of England in February 1689 and replaced James II as the ruler of England. James II, the last Roman Catholic ruler of England fled to France and William of Orange instituted financial changes that transformed the English economy. Between 1691 and 1700, seven companies traded in London with the East India Co. and the Bank of England representing 80% of the capitalization. Neither Paris nor Amsterdam had such an array of companies for shareholders to invest in.
Between 1688 and 1697, the Nine Years’ War was fought between the European coalition of the Holy Roman Empire, the Dutch Republic, Spain, England and Savoy against the French. Over time, the war financially exhausted all the countries that were involved, and drove the price of English stocks down until the war ended in 1697 as is illustrated in Figure 1. The war was resolved by the Treaty of Ryswick. Peace negotiations began in May 1697 and the Treaty was signed by the Dutch Republic, England and Spain on September 20, 1697.

Figure 1. GFD World Index, 1685 to 1705
The Death of Charles II Bear Market
Once the war was concluded, stocks recovered rapidly. Between October 1696 and February 1700, stocks rose in price by 175%. East India Co. stock, which had fallen from 500 in 1685 to 32.25 in 1698 recovered to 147 in 1700. The childless Charles II of Spain died in November 1700 and Philip V became the King of Spain on November 16, 1700. Britain moved into a recession in February 1701 and on May 15, 1701, the War of the Spanish Succession began. East India Co. stock fell from 118.5 on January 4, 1701 to 59 on March 7, 1701. Disputes over the separation of the Spanish and French crowns and commercial rights led to war in 1701 between the Bourbons of France and Spain and the Grand Alliance. Fears of war, France and Spain falling under a single crown and commercial rights produced the crash of the market in 1700.
After this crash, stocks rose in price for the next three years, peaking in April 1704. The Allied forces proved successful in the war until 1706, forcing the French back within their borders. The Allies also took command of the seas leading to successful offensives in Spain, but because of a lack of support for the Allies in Spain, the Allies were unable to hold the territory they seized.
The War of the Spanish Succession Bear Market
As the war dragged on, it began to drain the finances of the participants. This led to a slow, but steady decline in the stock market as is illustrated in Figure 2. The market declined in value until March 1712 by which time the market had registered a 40% decline from its peak in 1704. As the chart shows, there were particularly strong drops in October 1708 and November 1711.
1708 had a number of important battles in the war. On September 28, during the Battle of Lesnaya, the Swedish were routed in a snowstorm by Peter the Great of Russia and marked a turning point in the Great Northern War. At the Battle of Wijnendale, also on September 28, the English General Webb defeated the French near Torhout. The French and Allies were reaching the point of financial exhaustion and this drove the market down.
It should be remembered that the War of the Spanish Succession was fought during the period of Mercantilism in which trade was seen as a zero-sum game. Dutch and English support for the Hapsburg cause was seen as a desire to access Spanish-American markets at the expense of France and Spain. Because of the threat to trade, the war expanded to North America, India and Asia making the War of the Spanish Succession a world war.
The British secretly negotiated peace terms directly with the French leading to the signing of the Preliminary Articles of London on October 8, 1711. The French accepted the Act of Settlement and provided a guarantee that the French and Spanish crowns would remain separate. This formed the basis of the Treaty of Utrecht which ended the war on April 11, 1713. With peace at hand, the market bounced back.

Figure 2. GFD World Index, 1702 to 1722
The Mississippi and South Sea Bubbles
The War of the Spanish Succession imposed huge debts on all of Europe. England’s debt rose from £0.7 million in 1688 to £53.9 million in 1720. During the same period of time, England’s GDP rose from £70 million to £80 million so the debt/GDP ratio rose from 1% in 1688 to 67% in 1720. France saw a similar increase in their government debt which rose until it was close to French GDP. The desire of both the U.K. and France to eliminate their debt led to the Mississippi Bubble in France and the South Sea Bubble in England in which the government encouraged investors to trade their government debt for equity in the Compagnie d’Occident in France and the South Sea Co. in England. The government promised that these trade monopolies would pay large dividends. Through manipulation of the stock price, which would have given heart attacks to members of the SEC, the price of Compagnie d’Occident shares rose from 300 livres in 1718 to 10,000 livres in 1719 and South Sea stock rose in price from £100 in 1718 to £1000 in 1720. There was a mad rush into Compagnie d’Occident shares in France, and investors took their profits from the stock to invest in shares in London where South Sea Co. shares soon soared in price.
The bubble was unsustainable and despite the efforts of the governments in Paris and London to keep the price of stocks at these overvalued levels, once the shares started to decline in price and investors began losing money, the price of stocks collapsed back to their levels before the bubbles began. After the bubbles popped, investors were afraid to invest in equities and the Bubble Act, passed in the middle of the South Sea Bubble, restricted the creation of new companies. With less money available for equities, the amount of money available for government bonds rose throughout the 1700s to fund the wars between the United Kingdom, France and the Netherlands. It is interesting that the four bear markets that occurred between 1688 and 1720 were all driven by the wars between England and France. Although it might take weeks for the results of a battle in Sweden or France to reach financial markets in London, success and failure in war drove the markets up and down.
British debt rose from £0.7 million in 1688 to £843 million in 1818 while the capitalization of the British stock market rose from less than £1 million to £70 million. After the wild gyrations of stocks between 1718 and 1720, investors preferred the relative safety of government bonds to volatile equities. Investors in the 1700s were focused on yield. They did not buy stocks or bonds to make a capital gain, but to receive a steady flow of income. Figure 3 compares the performance of global stocks between 1729 and 1815 with the performance of British 3% Consols. Although stocks outperformed consols, the dates of the rises and falls in the prices of stocks and bonds was very similar. Because of the focus on yield, in the 1700s, bond and equity markets were highly correlated with one another.
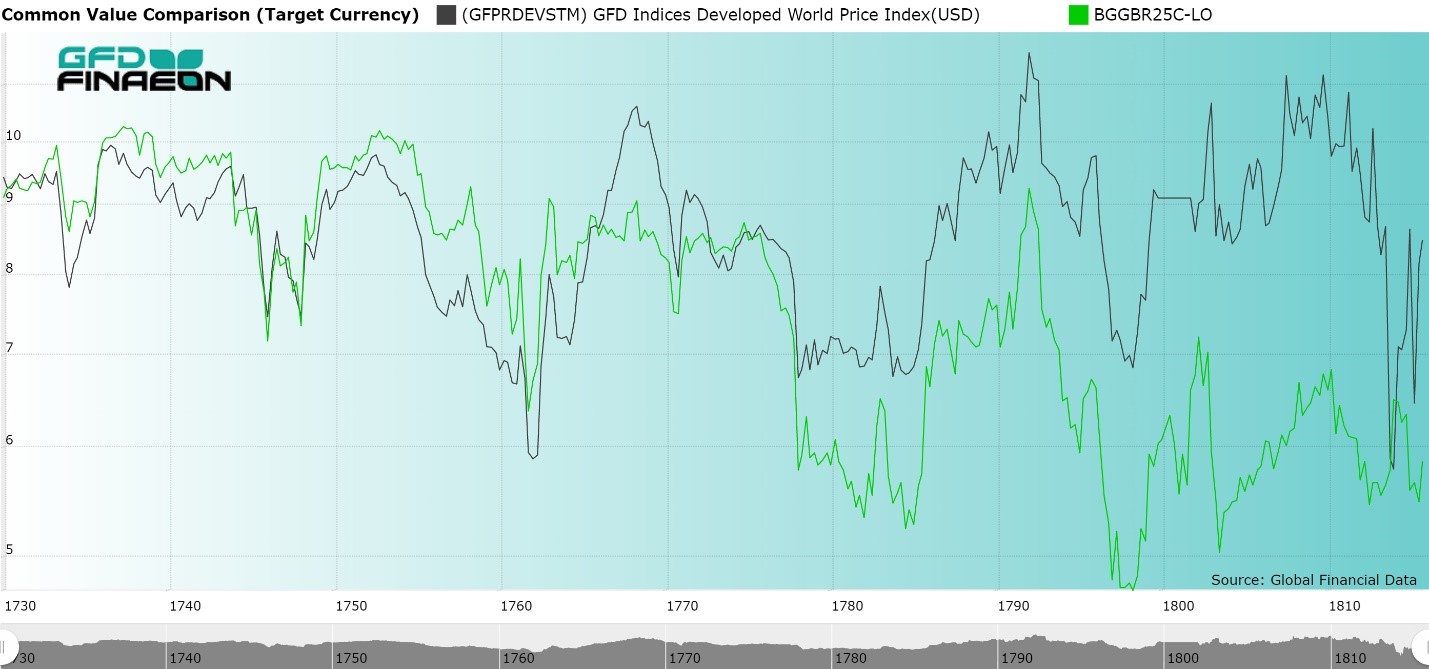
Figure 3. GFD World Index and British 3% Consols, 1729 to 1815
There were few bull markets in the 1700s because there were few opportunities for capital gains. There were two bull markets in the last half of the 1700s. One occurred between 1762 and 1768 and the other between 1784 and 1792, but the rest of the time stocks gradually drifted down in price, causing capital losses, but increasing the yield to investors. Both the Seven Years’ War between England and France and the Carnatic War in India ended in 1763 leading to a period of peace, and when the American Revolutionary War ended in 1783, there followed ten years of no war before the French Revolutionary Wars engulfed the continent. Bear Markets occurred between 1768 and 1784 when the market declined by 37% and between 1792 and 1797 when the market declined by 41%.
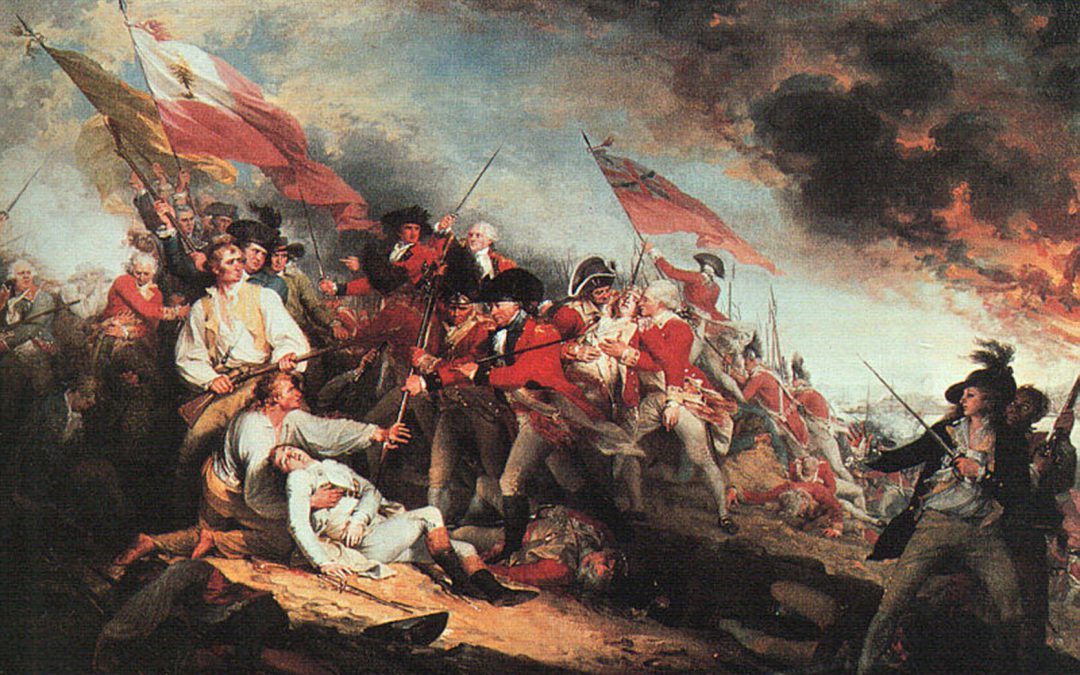
The American Revolutionary War Bear Market
Stocks were in a bear market between May 1768 and October 1784. The largest portion of the decline in this bear market occurred between June 1777 and March 1778 when British efforts to end the American Revolution failed. The British thought they could easily defeat the Americans in the war, and they plotted their northern strategy to win the war. Under this plan, John Burgoyne would establish control of the Champlain-George Hudson route from New York to Quebec in order to isolate New England from the other colonies. The British would then concentrate their forces on the southern colonies where they believed they would receive support from loyalist forces enabling them to win the war.
Despite capturing Philadelphia on September 26, 1777 General Howe failed to follow up on his victory. On June 18, 1778, the British departed Philadelphia and by July, both armies were in the same position they had been at two years before. The French signed a Treaty of Friendship with the United States and declared war on England in 1778. The French, Spanish and Dutch joined the side of the Americans, and the war grew to include Europe, India and the West Indies. This eventually led to the British defeat at Yorktown on October 17, 1781. Preliminary peace articles were signed in Paris on November 30, 1782. Between 1784 and 1792, both the stock market and the price of consols moved up as peace prevailed over Europe.
The French Revolution Bear Market
The French Revolution broke out in 1789. The Bastille was stormed on July 14, 1789 and the Declaration of the Rights of Man occurred in August 1789. France declared war on Prussia and Austria in the Spring of 1792 leading to French victory at the Battle of Valmy in September 1792. France became a republic in September 1792 and King Louis XVI was beheaded in January 1793. Napoleon led his first campaign in Italy in 1796. With French forces marching toward Vienna and having taken over 150,000 prisoners, the Austrians sued for peace.
The market declined by 41% between March 1792 and May 1797 while France was succeeding on the battlefield. The Armistice of Leoben was signed on April 18, 1797 and the Treaty of Campo Formio was signed on October 18, 1797 bringing an end to the War of the First Coalition. This agreement left Great Britain alone to fight against the French. Given the success of the French and the failure of the Allies, it should not be surprising that the stock market and the price of consols plummeted to lows in 1798 that hadn’t been reached in decades. The price of the consol fell from 97 in March 1792 to 47.75 in January 1798, raising the yield on consols from 3.09% to 6.28%. This was the lowest price the consol would reach until the inflation of World War I.
The French Revolutionary War, in general, had an adverse impact on all the financial markets in Europe. The Dutch East India Co. and Dutch West India Co. went bankrupt. The Paris stock exchange was closed on June 27, 1793 and all joint-stock companies were banned in France on August 24, 1793. France defaulted on its pre-revolutionary debt in 1796. Bondholders in both France and in the Netherlands ended up receiving new bonds worth 1/3 of the value of the pre-revolutionary bonds imposing large losses on bondholders. Sweden, the Netherlands, Portugal, Spain and Russia all suspended interest payments at some point during the Napoleonic Wars. The only country that didn’t default on their bonds was the United Kingdom.
When peace finally broke out in 1815, the world had changed dramatically from the world before the French Revolution. Organized stock exchanges in London and New York saw dozens of stocks trading on a regular basis. Stock exchanges in Paris, Amsterdam, Vienna and Berlin emerged as new companies listed and a century of dramatic growth in stock markets began.
The Century of Wars
The 1700s were a rough time for investors. Periodic wars between England, France, the Netherlands and rest of the world imposed losses on shareholders. The Nine Years’ War (1688-1697), the War of the Spanish Succession (1701-1714), the Seven Years’ War (1754-1763), the American Revolutionary War (1775-1783) and the French Revolutionary War (1792-1802) created bear markets investors could not avoid.
Several things should be pointed out about stocks and bonds in the 1700s that differentiate them from other centuries. Investors were primarily interested in one thing: yield. There was little inflation or capital gains and although stocks provided a higher return, the difference between the returns on stocks and bonds was small. Equities yielded 5.38% per annum in the 1700s while bonds yielded 4.15%.
At the same time, British debt grew dramatically as the United Kingdom borrowed money to pay for its wars. Equities and bonds were a close substitute and as Figure 3 shows, the price of stocks and bonds followed each other closely. During the 1700s, investors were mainly interested in receiving a return on their capital, not an increase in their capital. It wasn’t until the railway mania of the 1840s that investors were able to obtain large increases in dividends which led to capital gains for shareholders.
In many ways, the 1800s were the opposite of the 1700s. The century from 1815 until 1914 was a period of peace. The only major war during that time was the American Civil War. Wars in Europe, such as the Franco-Prussian War were short. One wonders whether the Industrial Revolution would have occurred in the 1700s if Europe had avoided the wars that occurred between 1688 and 1815. The peace between 1815 and 1914 allowed Europe to invest in railroads and other industries that created the modern world. While there were six bear markets between 1688 and 1799, there were only four bear markets in the world between 1800 and 1914. The thirty years of war between 1914 and 1950 led to four more bear markets. War is the enemy of all investors.
