Global Financial Data has added several new series to its Real Estate Database. We have added Real Estate indices for two new countries: Brazil and Croatia. The Brazil data are quarterly covering 11 metropolitan areas back to 2000, and the Croatia data are quarterly back to 1997. In addition to this, a monthly series for housing prices from the Netherlands was added which extends back to 1976.
The GFD Real Estate Database includes over 900 series from over 50 countries. About half of the series cover the United States, and about half of the series cover over 50 countries outside of the United States. The data extend back to 1835 for the United States and as far back as 1850 internationally. If you are interested in the Real Estate Database, please contact a GFD Salesperson.
 Some stocks have made incredible moves, rewarding investors immensely. In many cases, the most important part of the stock’s performance came before the company listed on the NYSE, not after. A good example of this is Kentucky Fried Chicken Corp (KFC).
Kentucky Fried Chicken Corp. incorporated on March 4, 1964, and merged into Heublein, Inc. on July 8, 1971. Before the original KFC (now owned by Yum! Brands, Inc.) was acquired, it had one of the most spectacular runs of the 1960s, but most of it occurred before KFC joined the NYSE.
The chart below shows KFC’s performance on the NYSE. Between the time KFC listed on the NYSE on January 16, 1969 and it was acquired on July 8, 1971, the stock is a sad site, losing half of its value by declining from 46.875 to 22.5.
Some stocks have made incredible moves, rewarding investors immensely. In many cases, the most important part of the stock’s performance came before the company listed on the NYSE, not after. A good example of this is Kentucky Fried Chicken Corp (KFC).
Kentucky Fried Chicken Corp. incorporated on March 4, 1964, and merged into Heublein, Inc. on July 8, 1971. Before the original KFC (now owned by Yum! Brands, Inc.) was acquired, it had one of the most spectacular runs of the 1960s, but most of it occurred before KFC joined the NYSE.
The chart below shows KFC’s performance on the NYSE. Between the time KFC listed on the NYSE on January 16, 1969 and it was acquired on July 8, 1971, the stock is a sad site, losing half of its value by declining from 46.875 to 22.5.


Some stocks have made incredible moves, rewarding investors immensely. In many cases, the most important part of the stock’s performance came before the company listed on the NYSE, not after. A good example of this is Xerox.
If you were to rely upon other data companies, you would never know what happened to Xerox Corp. before joining the NYSE. Xerox had 3:1 splits in March 1936 and April 1955, a 4:1 split in December 1959, and a 5:1 split in January 1964 after joining the NYSE. These four splits sum to 180:1. Haloid Co. incorporated in NY on April 17, 1906, changed its name to Haloid Xerox Inc. on April 15, 1958 and to Xerox Corp. on June 1, 1961. Xerox Corp. didn’t join the NYSE until July 11, 1961 after shedding Haloid from its name. The chart below shows Xerox’s performance on the NYSE since it joined in July 1961. The stock made a 15-fold move between mid-1961 and mid-1965, and despite some fluctuations since then, topping out in early 1999, the stock is currently below where it traded back in 1965. Xerox hit its nadir in February 1949 at 15, then double to 32.5 by the end of 1953, doubling in price. This is when Xerox began its spectacular rise. By the time it joined the NYSE in July 1961, it was trading at 104. Allowing for its two splits, this was the equivalent of 1248 in the old stock, an 83-fold increase from its nadir in February 1949. The graph below shows the complete history for Xerox, including its spectacular rise prior to joining the NYSE.
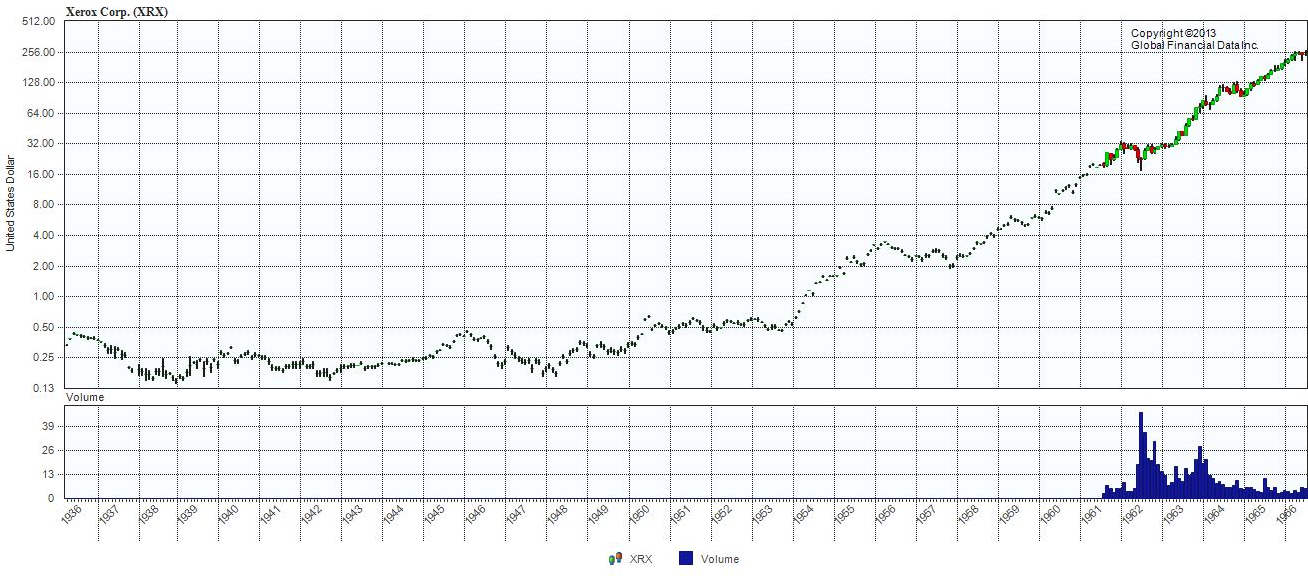
By the end of 1965, Xerox hit 215, or 12,900 in the old stock, an 860-fold increase, one of the most spectacular runs by any stock in history. Xerox’s all-time high was reached on May 3, 1999 when it closed at 63.6875. This is quite an increase from the split-adjusted price of $0.01389 the stock had been at in February 1949, an increase of over 4500-fold over a period of fifty years. This is much more spectacular than the 55-fold increase in price between July 1961, when Xerox joined the NYSE, and its peak on May 3, 1999. Complete histories are important. Otherwise, you’ll never discover some of the greatest moves in stock market history. Only at Global Financial Data are these complete.
