
The U.S. stock market fell into a bear market on March 12, 2020 ending the bull market that began in 2009. The bull market had begun on March 9, 2009 and peaked on February 19, 2020. The S&P 500 rose 400% between 2009 and 2020, the Dow Jones Industrials rose 351% between 2009 and 2020. The NASDAQ Composite fell into a bear market in 2018 when it declined 23%, bounced back 58% between 2018 and February 19, 2020. The NASDAQ has fallen 26% since then.
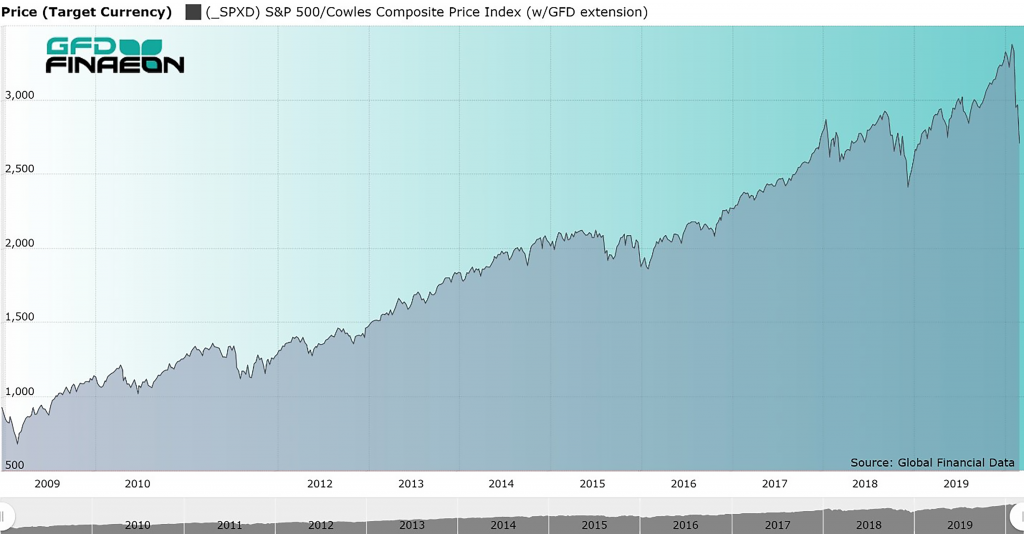 Figure 1. S&P 500, 2009 to 2020
The GFD US-100 Index provides more history than any other stock market index ever developed beginning in the year 1792. By our calculation, there have been twenty-four bull and bear markets since 1792 with four occurring in the 1800s, seventeen in the 1900s and three in the 2000s. The worst bear market was in 1929-1932, led by an 89% decline in the Dow Jones Industrials. The two previous bear markets in this century both had declines of 50% in 2000-2002 and 2007-2009. The 2000 bear market lasted over two years and the 2007 bear market over one year. By comparison, the 1987 and 1990 bear markets only lasted a few months before the market bounced back. What is interesting about this bear market is how quickly it hit and how sharply markets throughout the world have dropped in tandem in response to the Coronavirus epidemic. There was no gradual spread of this financial pandemic. It hit all the world’s stock markets simultaneously. In many countries, the 2020 bear market is a continuation of the bear market that began in 2018.
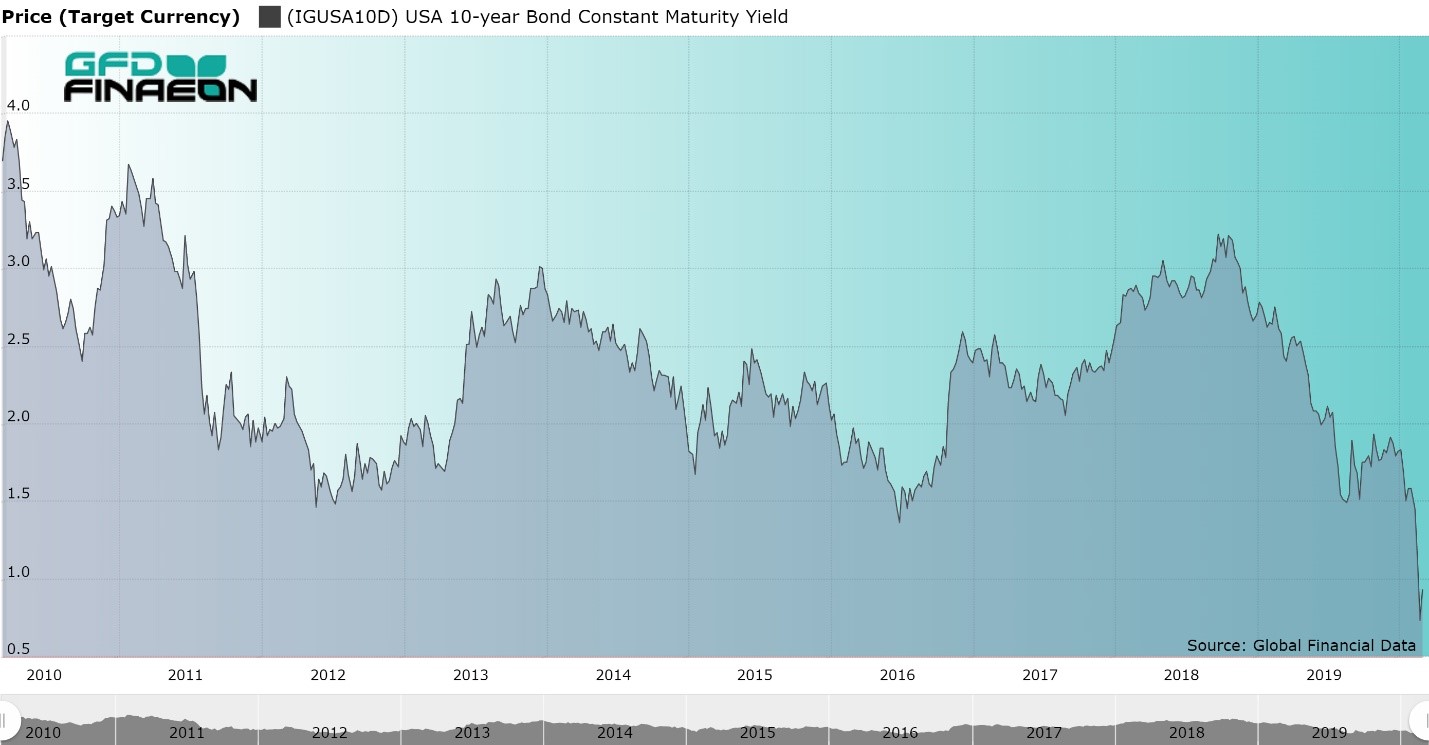 Figure 2. United States 10-year Bond Yield, 2010 to 2020
The extent of the bear market in 22 countries and for global indices is provided in Table 1. The table shows the date of the market top, the value the index hit on that date, the change from the previous market low, the current value of the market, and how much each market has fallen since the top in 2018 or 2020. The only major market in the world which has not fallen into a bear market this year is the Chinese market, the country where the coronavirus originated. However, the Chinese market has been in decline since 2015.
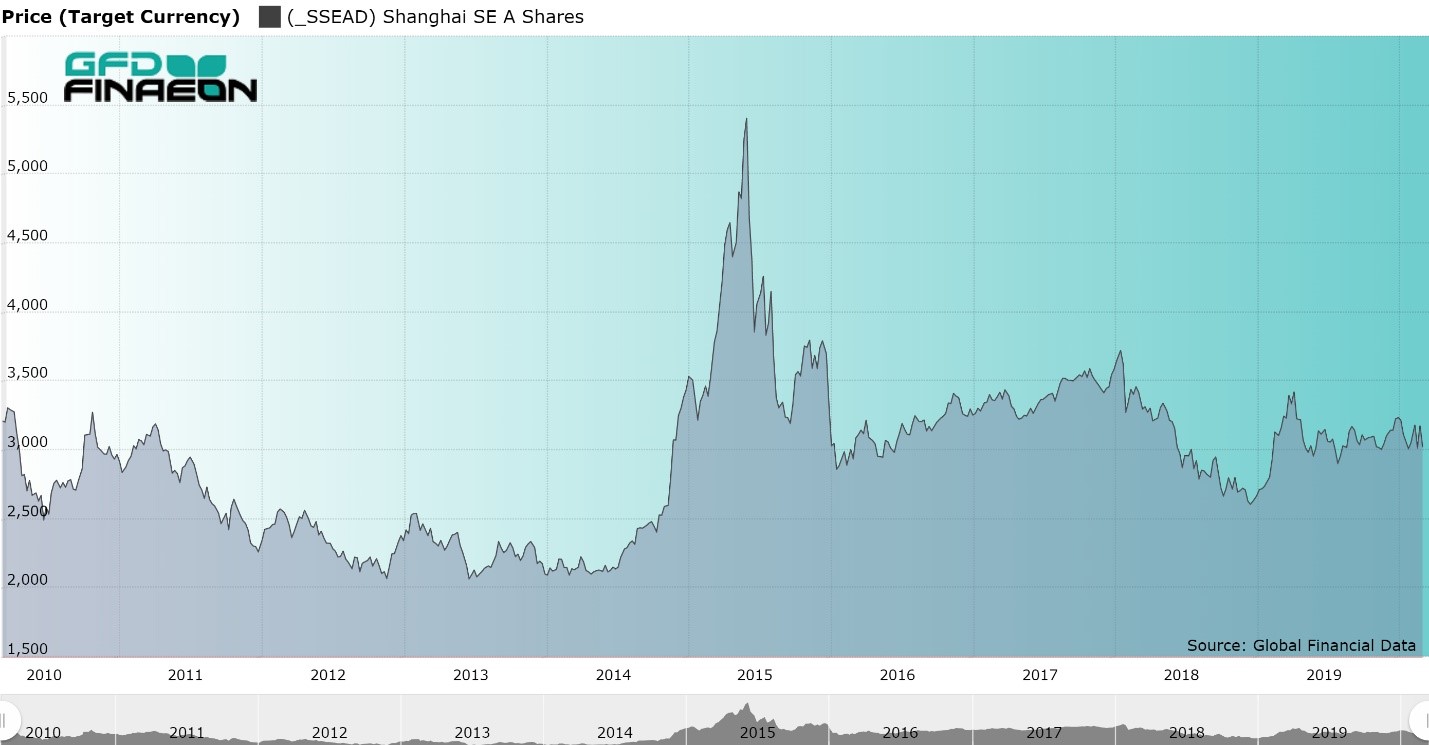 Figure 3. Shanghai Stock Exchange “A” Shares Index, 2010 to 2020
So far, global markets have fallen by around 30-40%. The question is, how much more are the markets likely to fall? Will this be a short-lived bear market as occurred in 1987 and 1990 or a more extended bear market as occurred in 2000-2002 and 2007-2009? It should be noted that fixed-income markets have already hit their bottom. This occurred on March 9 when the 10-year bond yield hit 0.381% and the 30-year bond fell below 1%. Yields have risen since then. Moreover, the Shanghai Index bottomed out on February 3, 2020 when the stock market reopened after the Chinese New Year and has not participated in the worldwide sell off. Both of these are positive signs that the bear market will not continue for an extended period of time. We will update Table 1 on a regular basis so our readers can follow the changes that occur in this bear market.
| Country | Index | Market Top | Value | Change | Market Low | Value | Change |
| Asia | |||||||
| Australia | All-Ordinaries | 2/20/2020 | 7255.2 | 133.16 | 3/23/2020 | 4564.10 | -37.09 |
| China | Shanghai A Shares | 6/12/2015 | 5410.86 | 165.15 | 12/27/2018 | 2600.05 | -51.95 |
| Hong Kong | Hang Seng | 1/26/2018 | 33154.12 | 80.98 | 3/23/2020 | 21696.13 | -32.76 |
| India | BSE Sensex | 1/14/2020 | 41952.63 | 82.79 | 3/23/2020 | 25981.24 | -38.07 |
| Japan | TOPIX | 1/23/2018 | 1911.31 | 59.77 | 3/16/2020 | 1236.34 | -35.31 |
| Singapore | FTSE ST All-Share | 1/24/2018 | 877.87 | 40.38 | 3/23/2020 | 540.60 | -38.42 |
| South Korea | Korea SE Price Index | 1/29/2018 | 2598.19 | 57.21 | 3/19/2020 | 1457.64 | -43.90 |
| Taiwan | Taiwan Weighted | 1/14/2020 | 12179.81 | 56.41 | 3/19/2020 | 8681.34 | -28.72 |
| Europe and Africa | |||||||
| Belgium | All-Share | 4/13/2015 | 13859.94 | 104.31 | 3/18/2020 | 7202.21 | -48.04 |
| France | CAC All-Tradable | 2/12/2020 | 4732.14 | 56.27 | 3/18/2020 | 2888.89 | -38.95 |
| Germany | CDAX Composite | 1/23/2018 | 625.19 | 50.07 | 3/18/2020 | 363.83 | -41.80 |
| Italy | FTSE Italia All-Share | 2/19/2020 | 27675.06 | 39.43 | 3/12/2020 | 16286.37 | -41.15 |
| Netherlands | All-Share Index | 2/12/2020 | 904.31 | 54.15 | 3/18/2020 | 574.88 | -36.43 |
| Norway | OBX Price | 9/25/2018 | 523.06 | 70.44 | 3/16/2020 | 329.67 | -36.92 |
| South Africa | FTSE All-Share | 1/25/2018 | 61684.8 | 246.26 | 3/19/2020 | 37963.00 | -38.46 |
| Spain | Madrid General | 4/13/2015 | 1203.82 | 99.78 | 3/16/2020 | 608.26 | -49.47 |
| Sweden | OMX All-Share Price | 2/19/2020 | 732.67 | 68.35 | 3/23/2020 | 478.95 | -34.63 |
| Switzerland | SPI Price Index | 2/19/2020 | 731.04 | 140.71 | 3/16/2020 | 548.52 | -24.97 |
| United Kingdom | FTSE-100 | 5/22/2018 | 7534.4 | 99.27 | 3/23/2020 | 4993.89 | -33.72 |
| Americas | |||||||
| Brazil | Bovespa | 1/23/2020 | 119528 | 217.51 | 3/23/2020 | 63451.55 | -46.91 |
| Canada | TSE-300 | 2/20/2020 | 17944.1 | 51.52 | 3/23/2020 | 11228.49 | -37.43 |
| Mexico | Mexico IPC | 7/25/2017 | 51713.38 | 206.16 | 3/23/2020 | 32936.60 | -36.31 |
| United States | DJIA | 2/12/2020 | 29551.42 | 351.37 | 3/23/2020 | 18576.04 | -37.14 |
| United States | S&P 500 | 2/19/2020 | 3386.15 | 400.52 | 3/23/2020 | 2236.7 | -33.95 |
| United States | NASDAQ | 2/19/2020 | 9817.18 | 58.52 | 3/23/2020 | 6860.67 | -30.12 |
| Global | |||||||
| Emerging Markets | MSCI Emerging Free | 1/29/2018 | 1278.53 | 85.69 | 3/23/2020 | 758.204 | -40.70 |
| Europe | MSCI Europe | 1/25/2018 | 1926.57 | 47.52 | 3/23/2020 | 1152.698 | -40.16 |
| World | MSCI World | 2/12/2020 | 2434.95 | 35.63 | 3/23/2020 | 1602.105 | -34.20 |
| World | MSCI EAFE | 1/25/2018 | 2186.65 | 46.52 | 3/23/2020 | 1354.30 | -38.07 |
 |
Dr. Bryan Taylor, President and Cheif Economist for Global Financial Data, speaks with KPCW, Mountain Money about the impacts the Spanish Flu had on the stock market in 1918 and how we can look at that data to understand the current market and impacts from COVID-19. |
[embed]https://cpa.ds.npr.org/kpcw/audio/2020/03/mm_03162020_dr_bryan_taylor.mp3[/embed]
https://www.kpcw.org/post/spanish-flu-and-stock-market-how-can-we-use-data-today#stream/0
Full Article

Everyone is concerned about the coronavirus and how it is impacting the global economy. Parts of China have been quarantined to prevent the spread of the virus and the world is wondering how the virus will disrupt supply chains between China and the rest of the world and how it will impact global travel. Will cities that are cut off from the rest of the world be able to contribute to the global economy?
The main precedent for the coronavirus is the SARS epidemic of 2002-2004, but you should also look at the more serious Spanish Flu pandemic of 1919. It is estimated that the Spanish Flu infected 500 million people worldwide, or about 27% of the world’s population and killed between 30 million and 50 million people, or about 1.7% of the world’s population. Were a similar pandemic to hit the world today, this would translate into 100 million deaths. This made the Spanish flu one of the deadliest epidemics in history. The pandemic occurred in the last year of World War I and military censors in France, Germany, the United Kingdom, United States and other countries were told to control information on the flu fearing that it would affect their ability to win the war, but there was no censorship on the flu in neutral Spain where King Alfonso XIII took ill. This gave the world the false impression that the flu originated in Spain, hence the name.
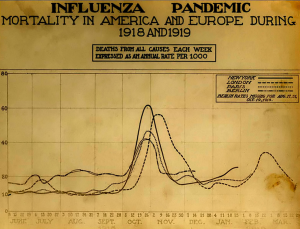
The Spanish flu came in three waves as is illustrated in Figure 1. The first wave, which made people notice the flu, occurred in July 1918. The second and most deadly wave occurred in October 1918 and resulted in millions of deaths. A final wave of the flu occurred in February 1919, and after that, the flu disappeared. Either the virus mutated to a less lethal form or doctors got better at treating or preventing it. Just as no one knows for sure exactly where the virus came from, no one knows why it disappeared.
Figure 1. Death Rates of the Spanish Flu, June 1918 to May 1919
It is interesting to contrast the response of the stock market to the Spanish flu in 1919 with the coronavirus in 2020. The Dow Jones Industrial Average fell over 2,000 points in four days out of fear that the coronavirus will continue to spread and impact the global economy. The fear is that cities will become quarantined, supply chains will be broken, world trade will be impacted and growth in the global economy will slow down.
However, the impact of the Spanish Flu on the stock market was minimal. If you look at the Dow Jones Industrial Average in 1918 and 1919, you can see that the stock market was relatively unaffected by any of the three waves of the Spanish flu. Of course, the Spanish flu occurred in 1918 while World War I was raging in Europe so the war had a larger impact on the stock market than the flu. There were few if any global supply chains that the Spanish Flu could disrupt because the war made supply chains nonexistent. The second and worst wave of flu occurred at the end of World War I when peace was finally achieved after four years of devastating destruction. It is interesting that there was little impact on the stock market of World War I ending on November 11, 1918. Perhaps euphoria about the conclusion of the war was offset by concerns about the Spanish flu.
It is comforting to see that when the final wave of the Spanish flu subsided in February 1919, the market began an increase of 50% which lasted until November of 1919. Whether this increase occurred because of the end of World War I or the end of the flu or both is impossible to say, but it does provide encouragement that once the coronavirus begins to subside, the market will bounce back once again.