 Global Financial Data has reorganized its sector and industry classification system to make Communications a separate sector. The introduction of the internet 25 years ago has transformed the world and will continue to change the global economy in ways we still cannot predict. Many services which formerly were provided through brick and mortar stores are now provided online. Businesses which formerly were included in Consumer Discretionary, such as Media and Broadcasting or the Internet in Information Technology have more in common with each other than was formerly realized.
A company such as Amazon not only has a huge retail business, but also hosts huge amounts of data on the cloud and provides streaming services for video and music. Netflix not only rents and streams video, but produces its own movies and series, as does Amazon. These changes have caused a re-evaluation of the classification system of industries and sectors by all of the index providers.
Global Financial Data has reorganized its sector and industry classification system to make Communications a separate sector. The introduction of the internet 25 years ago has transformed the world and will continue to change the global economy in ways we still cannot predict. Many services which formerly were provided through brick and mortar stores are now provided online. Businesses which formerly were included in Consumer Discretionary, such as Media and Broadcasting or the Internet in Information Technology have more in common with each other than was formerly realized.
A company such as Amazon not only has a huge retail business, but also hosts huge amounts of data on the cloud and provides streaming services for video and music. Netflix not only rents and streams video, but produces its own movies and series, as does Amazon. These changes have caused a re-evaluation of the classification system of industries and sectors by all of the index providers.
Global Financial Data’s classification system is based upon 12 sectors and 72 industries. While most other providers have Sectors and Sub-Sectors, Industries and Sub-Industries, we keep it simple and limit our system to Sectors for the whole economy and the industries that make them up.
GFD’s sectors differ from other index providers because we keep Transportation as a sector rather than making it part of the Industrials as other providers do. GFD focuses on sectors and industries that have existed over the past 200 years, not just the ones that exist today. The Transportation sector laid the foundations of the stock market back in the 1800s and deserves to be recognized for this as a separate sector.
While other index providers periodically rejig their classification system to adjust to new trends in the market and investing, Global Financial Data has created a timeless system that covers over two centuries of sector classification and recognizes industries that no longer exist. Canals and Docks have their own industry because that industry dominated the stock market in England in the early 1800s. Telegraphs, Cables and Express were all important industries in the 1800s, but no longer exist. We don’t delete industries that economic change has eliminated.


The Risk-Free Rate of Return is an important concept in financial markets since it provides the return an investor can receive on his money without running any risk of loss. Typically, the rate of return is measured by the one-month treasury bill issued by the government. But what happens when there are no Treasury bills to measure the risk-free rate of return?
Investors in government bonds have found out that government bonds are not risk free, even if there is virtually no risk of default, because the price of the bond produces capital gains and losses to bondholders. The longer the maturity of the bond, the greater the change in the price of the bond whenever bond yields change. Treasury bills, on the other hand, are redeemed within a month at their face value, and short of a default, there is no risk of loss due to capital gains or losses.
But what if there are no Treasury bills, as was generally the case in the 1800s, that investors can use for a risk-free investment? One alternative is the interest rate the central bank pays on deposits with the bank. England has had a central bank beginning in 1694 and this rate enables historians to provide a risk-free rate of return in Great Britain for over 300 years.

Global Financial Data’s analysis of global markets gives a positive review for 2018.
Our review for 2017, “2017: Let the Bull Markets Continue,” hit the mark right on the spot. We noted that a “relatively large number of countries put in … a bear market bottom in 2016. Investors should expect that global markets will continue a bull market run in 2017.” And right we were.
Global Financial Data covers over 100 stock markets worldwide with over 100 years of data on bull and bear markets back to the 1800s. We keep track of the tops of bull markets and the bottoms of bear markets. A market top occurs when a peak is reached followed by a 20% decline. A market bottom occurs when a stock market hits a trough which is followed by a 50% or greater rise.
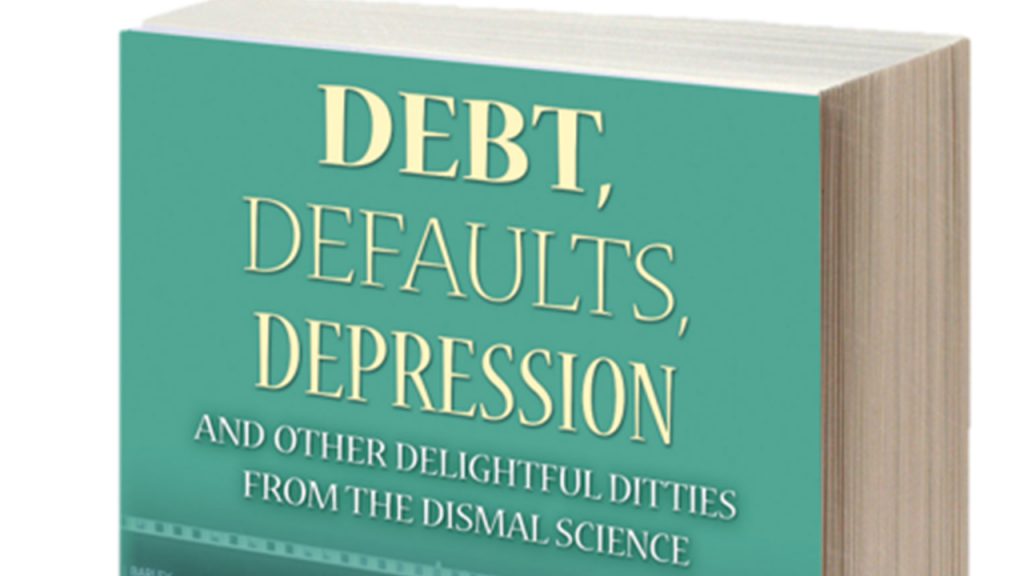 Bryan Taylor, Chief Economist for Global Financial Data, has just released his first collection of articles and blogs on financial history. The book is a light-hearted look at some of the more entertaining episodes of economic history. There are 27 chapters covering a wide variety of topics. You can either read the book straight through or pick it up for a single chapter.
Bryan Taylor uses his knowledge of the past to illustrate how corporations and governments have helped and harmed the economy and financial markets. Readers will learn about the greatest counterfeiter of all time, the first publicly traded bonds, the worst inflation in history, the currency that created two countries, zombie bonds, and the New Jersey tailor who went to jail for undercutting other tailors by 5 cents.
Taylor provides his insights on the gold standard, government debt, the stock market and why the Fed will keep interest rates low for years to come. He discusses why the gold standard will never return and provides his own theory of the equity-risk premium and how it has changed over time. The author also gives his own personal experience of the Alice-in-Wonderland world of Cuban economics.
Whether looking for an amusing glimpse into the past or to learn how the economy can affect the stock market, Debt, Defaults, and Depression provides this and more. Even people who think calling economics the "dismal science" is being too kind will enjoy this book.
The book is available from Amazon as both an e-book for Kindle and as a paperback to be taken to the beach or on an airplane.
This book is the first of two collections of articles and blogs that Taylor has written. Taylor’s second collection of blogs, Stock Market Scams, Swindles and Successes will be released this summer.
Bryan Taylor, Chief Economist for Global Financial Data, has just released his first collection of articles and blogs on financial history. The book is a light-hearted look at some of the more entertaining episodes of economic history. There are 27 chapters covering a wide variety of topics. You can either read the book straight through or pick it up for a single chapter.
Bryan Taylor uses his knowledge of the past to illustrate how corporations and governments have helped and harmed the economy and financial markets. Readers will learn about the greatest counterfeiter of all time, the first publicly traded bonds, the worst inflation in history, the currency that created two countries, zombie bonds, and the New Jersey tailor who went to jail for undercutting other tailors by 5 cents.
Taylor provides his insights on the gold standard, government debt, the stock market and why the Fed will keep interest rates low for years to come. He discusses why the gold standard will never return and provides his own theory of the equity-risk premium and how it has changed over time. The author also gives his own personal experience of the Alice-in-Wonderland world of Cuban economics.
Whether looking for an amusing glimpse into the past or to learn how the economy can affect the stock market, Debt, Defaults, and Depression provides this and more. Even people who think calling economics the "dismal science" is being too kind will enjoy this book.
The book is available from Amazon as both an e-book for Kindle and as a paperback to be taken to the beach or on an airplane.
This book is the first of two collections of articles and blogs that Taylor has written. Taylor’s second collection of blogs, Stock Market Scams, Swindles and Successes will be released this summer.

