S&P Dow Jones announced its reorganization of the Dow Jones Industrial Average (DJIA) today. Apple stock is splitting 4-for-1 on August 31 and S&P Dow Jones wanted to take advantage of this stock split to reorganize the DJIA. The DJIA is not market-cap weighted, but price weighted. To calculate the value of the DJIA, you sum up the price of each of its 30 components and divide by the divisor, which is currently 0.145798. When Apple splits 4-for-1 the divisor will have to change, so S&P Dow Jones decided to create a post-Covid DJIA. ExxonMobil, formerly Standard Oil of New Jersey, was removed from the DJIA, but Chevron, formerly Standard Oil of California, will remain. As ExxonMobil (XOM) is removed, so will Pfizer (PFE) and Raytheon (RTX) and in their place Salesforce.com (CRM), Honeywell (HON), and Amgen (AMGN) will be added. Honeywell was a member of the DJIA between 1925 and 2008. Goodbye to an Original DJIA Member ExxonMobil had been in the DJIA longer than any other stock, having been added on October 1, 1928. Chevron was added to the DJIA on February 19, 2008 (Chevron was in the DJIA in 1924-1925 and 1930-1999). Atlantic Richfield, another Standard Oil stock, was in the DJIA between 1928 and 1930. Ten years ago, ExxonMobil was the largest corporation in the world. Since then, ExxonMobil’s capitalization has halved while the tech giants have grown in size. We discussed ExxonMobil in our blog “The First Billion Dollar Company.” When the Supreme Court ordered the dissolution of Standard Oil on May 15, 1911, it was the largest corporation in the world, representing 6% of the capitalization of all shares in the United States. The company’s shares were not listed on the NYSE because Standard Oil did not want to file its financial reports with the NYSE, so the stock traded over-the-counter. Standard Oil had 1 million shares outstanding and shares traded around 650 when the antitrust lawsuit was filed by the government in 1909. The price stayed at that level until the antitrust decision was handed down in 1911. Standard Oil’s price is illustrated in Figure 1. 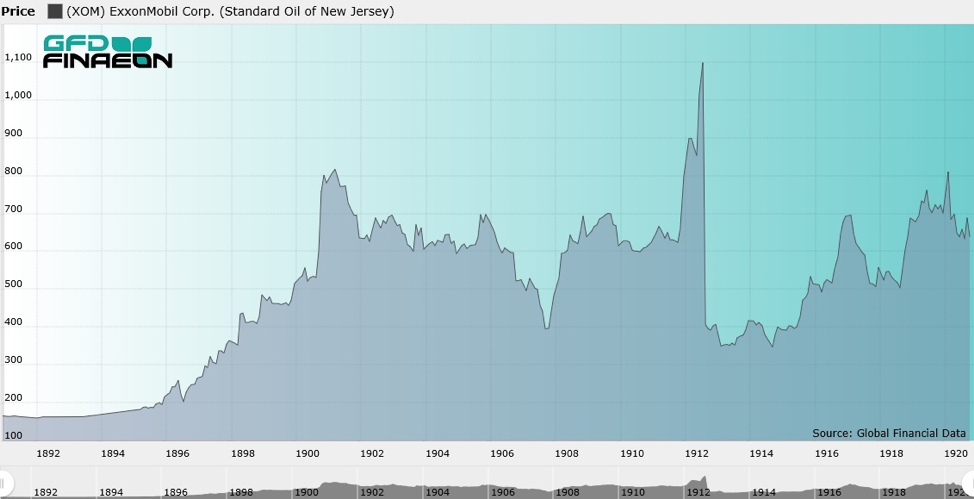 Figure 1. Standard Oil of New Jersey 1890-1920 On May 15, 1911, the Supreme Court decreed that Standard Oil should spin off 34 subsidiaries to its shareholders. Under the distribution made December 1, 1911, the stockholders of Standard Oil received one share of Standard Oil Co. of New Jersey and varying amounts of the 34 subsidiaries that were spun off from Standard Oil. The 1st Billion Dollar Company: Standard Oil By August 1912, when the distribution occurred, Standard Oil stock had risen in price to 1100 making Standard Oil the world’s first billion-dollar corporation. In September 1912, Standard Oil distributed shares in the Standard Oil Subsidiaries, which traded separately from Standard Oil of New Jersey between September 1912 and February 1914. The Subsidiary’s stock price rose from 675 to 990 in February 1914, as illustrated in Figure 2, while shares of Standard Oil of New Jersey were virtually unchanged. The subsidiaries appeared to be the better value. But were they?
 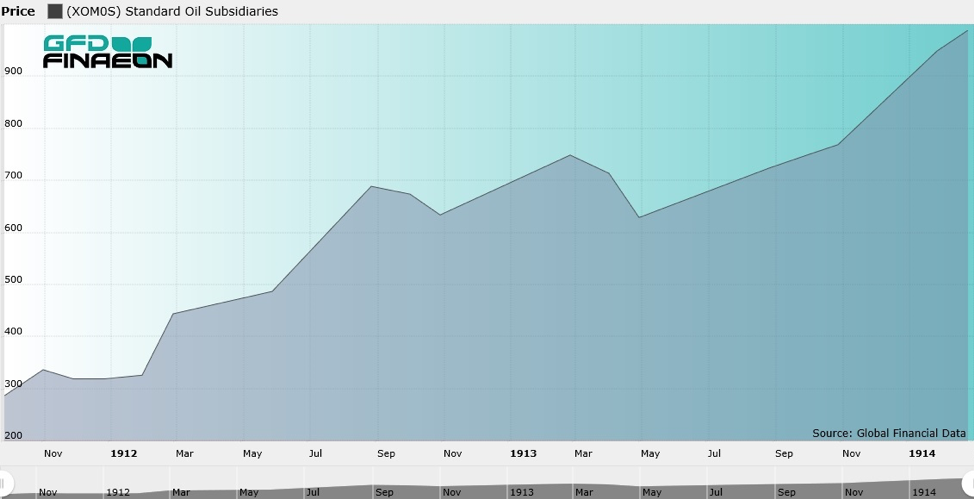 Figure 2. Standard Oil Subsidiary Stock 1911-1914Fate of the Break-Up To answer this question, we took the prices of the 34 subsidiaries that were spun off from Standard Oil to see how the 34 companies performed between September 1913 when the subsidiaries started trading and today. Out of the original 34 companies only two have survived: Standard Oil of New Jersey, which is now ExxonMobil, and Standard Oil of California, now Chevron, both of which were in the DJIA yesterday. All these other companies either liquidated or were bought out by another company. The fate of the 34 subsidiaries is provided in Table 1.
| Name | Acquired | Delisted |
| Pierce Oil Corp. | 11/30/1938 | Dissolved in 1940 |
| Colonial Oil Co. | 4/30/1919 | Began liquidating in 1916 |
| Vacuum Oil Co. | 6/30/1920 | Socony and Vacuum merged into Socony-Vacuum in 1931 |
| Continental Oil Co. | 12/31/1924 | Merged into Continental Oil (ME) in 1924 |
| Washington Oil Co. | 10/30/1926 | Liquidated in 1957 |
| Crescent Pipe Line Co. | 12/31/1931 | Went into Liquidation in 1925 |
| Galena-Signal Oil Co. | 12/31/1931 | Acquired by Valvoline Oil Co. in 1931 |
| Solar Refining Co. | 12/31/1931 | Acquired by Standard Oil Co. of Ohio in 1931 |
| Cumberland Pipe Line Co. | 8/31/1934 | Completed liquidation in 1935 |
| Standard Oil Co. (Neb.) | 10/31/1939 | Acquired by Standard Oil Co. of Indiana in 1939 |
| Prairie Oil & Gas Co. | 4/30/1940 | Merged into Consolidated Oil Corp. in 1932 |
| Indiana Pipe Line Co. | 1/30/1943 | Merged into Buckeye Pipeline Co. in 1943 |
| New York Transit Co. | 1/30/1943 | Merged into Buckeye Pipeline Co. in 1943 |
| Northern Pipe Line Co. | 2/27/1943 | Merged into Buckeye Pipeline Co. in 1943 |
| Standard Oil Co. (Kan.) | 8/31/1950 | Recapitalized as Coastal Plains Oil Co. in 1944 |
| South West Pennsylvania Pipe Lines | 12/31/1952 | Completed its liquidation in 1954 |
| Eureka Pipe Line Co. | 3/30/1961 | Shares acquired by Pennzoil and Quaker State Oil |
| Standard Oil Co. (Ky.) | 10/31/1961 | Merged into Standard Oil co. of California in 1961 |
| National Transit Co. | 12/29/1961 | Acquired by Pennzoil in 1965 |
| Anglo-American Oil Co., Ltd | 5/29/1930 | Bought by Jersey Standard in 1930 |
| Buckeye Pipe Line Co. | 7/24/1964 | Acquired by the Pennsylvania Co. in 1964 |
| Southern Pipe Line Co. | 4/30/1965 | Merged into Ashland Oil & Refining Co. in 1965 |
| Swan & Finch Co. | 5/30/1969 | Completed its liquidation in 1974 |
| Trans-Union Corp. (Union Tank Line) | 2/10/1981 | Trans Union Corp. merged into Marmon Group in 1981 |
| Marathon Oil (Ohio Oil Co.) | 3/11/1982 | Merged into United States Steel Corp. in 1982 |
| Chesbrough-Ponds, Inc. | 2/10/1987 | Merged into Unilever in 1987 |
| Standard Oil Co. (Ohio) | 6/29/1987 | Merged into BP America Inc. in 1987 |
| Amoco Inc. (Standard Oil Co. (Ind.)) | 12/31/1998 | Merged with British Petroleum Co. in 1998 |
| PennzEnergy Co. (South Penn Oil Co.) | 8/17/1999 | Merged into Royal Dutch Petroleum in 1999 |
| Mobil (Standard Oil Co. of N. Y.) | 11/30/1999 | Merged into ExxonMobil in 1999 |
| Atlantic Richfield Co. (Atlantic Refining Co.) | 4/17/2000 | Merged into BP Amoco plc in 2000 |
| Chevron (Standard Oil Co. (Cal.)) | ||
| ExxonMobil Co. (Standard Oil Co. (N.J.)) |
Table 1. Fate of Standard Oil Subsidiaries We also recalculated the market capitalization of Standard Oil, summing together the market cap of Standard Oil of New Jersey and the subsidiaries that were spun off in 1913. We found that in most years between 1913 and 2010, Standard Oil would have been the largest corporation in the world. The subsidiaries had a larger market cap than ExxonMobil during most of the twentieth century. The market capitalization of ExxonMobil, the subsidiaries and the entire company at ten-year intervals is provided in Table 2.
| Year | Subsidiaries | ExxonMobil | Combined |
| 1911 | 665 | ||
| 1913 | 874 | 388 | 1,263 |
| 1920 | 1,357 | 614 | 1,971 |
| 1930 | 1,993 | 1,203 | 3,195 |
| 1940 | 1,207 | 938 | 2,145 |
| 1950 | 5,301 | 5,557 | 10,859 |
| 1960 | 9,087 | 8,931 | 18,019 |
| 1970 | 20,646 | 16,411 | 37,057 |
| 1980 | 89,619 | 34,859 | 124,478 |
| 1990 | 97,981 | 64,490 | 162,471 |
| 2000 | 54,193 | 302,211 | 356,405 |
| 2010 | 183,634 | 368,712 | 552,346 |
| 2020 | 227,869 | 295,247 | 523,116 |
Table 2. Market Capitalization of Standard Oil, 1911 to 2019 Shares in the subsidiaries began trading over-the-counter and on the New York Curb in September 1913. None of the Standard Oil companies traded on the NYSE at that point in time. Of the original 34 companies, 14 eventually moved to the New York Stock Exchange between 1918 and 1963. Standard Oil of New Jersey (ExxonMobil) and Atlantic Richfield moved to the NYSE in 1920 and Standard Oil of California moved to the NYSE in 1921. The remaining 20 companies remained on the Curb/AMEX until they were bought out or liquidated. The dates that each of the companies moved from the Curb to the NYSE is provided in Table 3.
| Company | Moved to NYSE |
| Pierce Oil Corp. | 8/31/1918 |
| Atlantic Richfield Co. (Atlantic Refining Co.) | 3/1/1920 |
| ExxonMobil Co. (formerly Standard Oil (N.J.)) | 3/1/1920 |
| Trans-Union Corp. (Union Tank Line) | 3/31/1921 |
| Chevron (Standard Oil Co. (Cal.)) | 6/30/1921 |
| Mobil (Standard Oil Co. of N. Y.) | 12/9/1926 |
| Prairie Oil & Gas Co. | 12/20/1928 |
| Standard Oil Co. (Kan.) | 3/27/1930 |
| Marathon Oil (Ohio Oil Co.) | 8/21/1930 |
| Amoco Inc. (Standard Oil Co. (Ind.)) | 8/30/1934 |
| Standard Oil Co. (Ohio) | 1/27/1941 |
| Buckeye Pipe Line Co. | 6/25/1956 |
| Chesebrough-Ponds, Inc. (Chesebrough Mfg. Co.) | 1/2/1962 |
| PennzEnergy Co. (Pennzoil - South Penn Oil Co.) | 8/30/1963 |
Table 3. Standard Oil Companies that Moved to the New York Stock Exchange In order to calculate the total return to investors, we assumed that whenever a company was dissolved or bought out, the cash from those shares was invested in the remaining Standard Oil companies, weighted by market capitalization. We treated Standard Oil as if it had been an ETF that could be re-invested in. Over time, the number of remaining companies declined until only two of them survived: Chevron and ExxonMobil. Figure 1 compares the returns to Chevron, ExxonMobil, (Standard Oil excluding ExxonMobil), and the S&P 500. The graph reflects the results in Table 4 with Chevron being the top performer and ExxonMobil second. Standard Oil excluding ExxonMobil and the S&P 500 performed similarly with the S&P 500 currently taking the lead over Standard Oil excluding ExxonMobil. Since 1913, the Standard Oil subsidiaries has been the worst performer of the four.  Figure 3. ExxonMobil, Chevron, Standard Oil Excluding Exxon and S&P 500, 1913 to 2020 As the Figure 1 shows, the two surviving companies have outperformed the rest of the subsidiaries. Chevron has had the highest return and ExxonMobil the second highest. The Standard Oil Subsidiaries, excluding ExxonMobil, were the worst performing of the four. In addition to the calculations for the return to all of the Standard Oil companies and Standard Oil excluding ExxonMobil, we also put together a subset of large Standard Oil companies that included Standard Oil Co. of Nebraska, Kansas, Kentucky, Ohio, Indiana, New York, California and New Jersey as well as the Ohio Oil Co. and Atlantic Richfield. These companies represented 75% of the capitalization of Standard Oil and its subsidiaries in 1913. GFD calculates custom price and return index series on all these companies and subjects. These are available as part of the GFD Indices. Table 4 provides information on the returns to each of the stocks and groups between September 1913 and July 2020. It is interesting that on a total return basis, all the Standard Oil choices outperformed the S&P 500.Nevertheless, the differences in the returns are small meaning that the Standard Oil stocks performed about the same as the rest of the stock market during the past 107 years. Both Chevron and ExxonMobil remain below the highs they reached in 2008. During the past 12 years, ExxonMobil’s annualized return has fallen from 7.92% in 2007 to 6.13% in 2020.
| Company | $1 Invested | $1 Invested | Annual Return | Annual Return |
| Price | Return | Price | Return | |
| Chevron | 4761.44 | 560850.7 | 8.24 | 13.17 |
| Exxon | 579.567 | 60536.83 | 6.13 | 10.84 |
| SO Large | 388.697 | 39004.71 | 5.73 | 10.38 |
| Standard Oil | 320.308 | 32682.73 | 5.54 | 10.20 |
| SO x/XOM | 282.143 | 30633.88 | 5.41 | 10.14 |
| S&P 500 | 383.48 | 26265.58 | 5.72 | 9.98 |
Table 4. Returns to Chevron, ExxonMobil, Standard Oil and the S&P 500, 1913 to 2020 And Then There Was One Salesforce.com replaced ExxonMobil because it reflects the American economy of 2020 better than ExxonMobil. The market capitalization of Salesforce.com is larger than that of ExxonMobil. We suspect that ExxonMobil was removed, rather than Chevron, because the price of ExxonMobil’s stock is lower than Chevron’s and there just wasn’t room for two former Standard Oil companies in the DJIA. Energy stocks have performed poorly since the Covid sell-off in February and few people believe that the price of oil will recover soon. Two years ago, General Electric, another long-term member of the DJIA was removed because its stock price had fallen so dramatically. Dow Jones changes the components of the DJIA as the demands of the economy shifts. The reduction in the number of energy stocks in the DJIA reflects the declining importance of energy in the world relative to other goods. Sources: GFDatabase, GFD US Stocks, and GFD Indices
