Global Financial Data’s Market Tops and Bottoms Indicator for 2022
Bryan Taylor, Chief Economist, Global Financial Data
Global Financial Data tracks bull and bear markets in over 100 stock markets. We have calculated when bull and bear markets have begun and ended throughout the world since 1602. We have over 400 years of data to analyze when bull and bear markets have begun and ended and the number of market tops and bottoms that have occurred each year worldwide. GFD defines a bear market as a 20% decline in the primary market index for each country and a bull market as a 50% increase in the primary market index. A market top occurs when the index declines by 20% or more after a 50% increase, and a market bottom occurs when the market rises by 50% or hits a new high after a 20% decline.
Global Bull and Bear Markets
Bear markets occur more quickly than bull markets and over a shorter period of time with higher daily volatility, so their occurrence is quickly noted. However, it may take several years for a market to make the 50% recovery that signifies a bull market and it is only then that analysts realize when the market bottom occurred. Otherwise, a market might decline by 25%, rise by 30%, then decline again by another 25% producing one long bear market and not a series of bear markets. This is what made the 1929-1933 bear market crash so memorable. There was a decline, recovery, another decline and another recovery for four years. Investors would expect that as the market bounced back the bear was gone, but the bear only reappeared and drove prices further down, ultimately declining by almost 90%.
How significant the market bottom is globally depends upon the number of markets that hit a bottom and start to bounce back. Global markets are integrated, and bear markets often occur across global markets simultaneously. This was seen in the Covid bear market of 2020. Since bear markets usually last a year or two and bull markets last five to ten years, a significant number of bear market bottoms can give investors confidence that a new bull market has begun that they can invest in for several years to come.
Figure 1 shows the number of market tops minus the number of market bottoms in each year since 1900. More market tops show the end of a bull market, and more market bottoms show the end of a bear market. The market tops in 1920, 1929, 1937, 1969, 1973, etc. are clearly visible while the market bottoms in 1921, 1932, 1940, etc. are visible as well. There were fewer market tops and bottoms in the 1950s and 1960 as the bull market roared ahead. The actual number of tops and bottoms expanded in the 1990s when many countries opened stock markets increasing the number of markets that were followed. After the market peaked in 2000, it took three years of bear market bottoms for global markets to start moving forward again. 2007 had the largest number of bull market peaks in history followed by the largest number of bear market bottoms’ however, the number of market bottoms in 2020 when Covid struck exceeded the number of bear market bottoms in 2009. This shows that the degree of integration of global equity markets has increased over time.
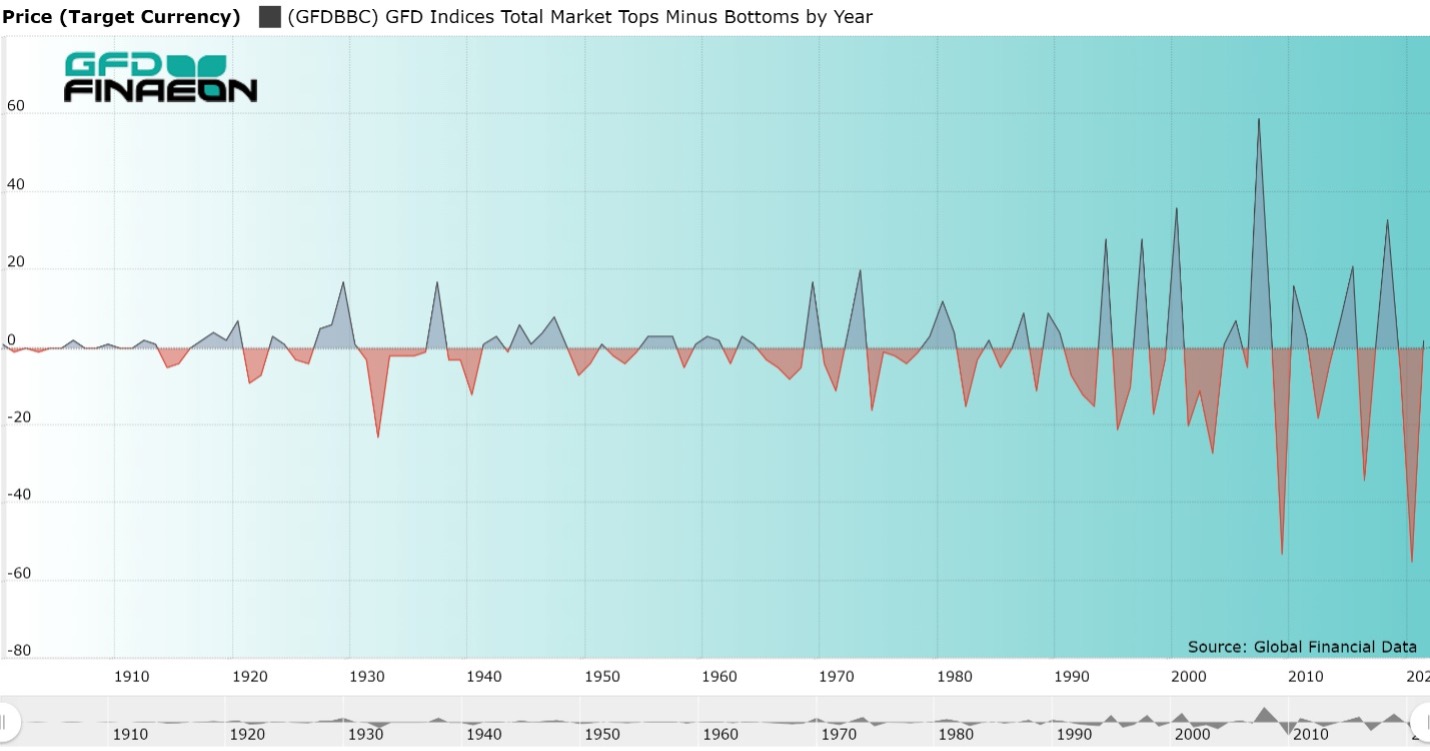
Figure 1. GFD Total Market Tops Minus Market Bottoms, 1900 to 2019
Between 2009 and 2020, the U.S. Stock market rose while other global stock markets treaded water. While U.S. Stocks, especially communication and information technology stocks, did well during the past decade, Emerging Markets and much of Europe failed to exceed their 2008 highs. This is reflected in the up and down uncertainty of market tops and bottoms. There were three net tops in the world’s stock markets during the past decade in 2010, 2015, and 2018 and market bottoms in 2009, 2012 and 2016.
The Impact of Covid and Ukraine
When Covid struck, it led to the largest number of bear market bottoms in the past 100 years. Although some stock markets had hit their bull market peaks in 2018, most of the remainder topped out in early 2020. In 2020, 95 stock markets suffered through bear markets and hit their bottom, almost all in March 2020 before beginning a new bull market. The Covid bear market was both the most coordinated global bear market in history, and the shortest bear market in history, lasting only two months in some countries, such as the United States.
Some bear markets signal a change in leadership and investment patterns moving money from emerging markets to developed markets, or from Europe to Asia, or vice versa. However, no such pattern was observed here.
The shortest global bear market in history may be followed by one of the shortest bull markets in history. The invasion of Ukraine by Russia has pushed a number of countries and geographical regions into a bear market. Emerging markets, NASDAQ, Germany and Russia, among others, have all been pushed into a bear market a little over a year after emerging from the Covid bear market. Emerging markets hit their bull market peak in January 2021, less than a year after the bear market bottom in March 2020 and have been declining since then.
How many markets fall into a bear market depends upon how Russia’s war on the Ukraine proceeds and how it affects the rest of the world. If the war intensifies and draws other countries into the conflict, further declines in stock markets are possible; however, the bear market that emerges from Russia’s invasion of Ukraine is unlikely to have the coordinated impact of the Covid bear market.
While the bear markets of 2000 and 2008 were driven in large part by stock market bubbles that led to 50% declines, the past two bear markets were driven by external events, the Covid pandemic and the Russian invasion of Ukraine. Low interest rates have driven the price of stocks higher producing stronger reactions to external events.
Although yields on government bonds remain low, inflation is on the rise and this will inevitably impact bond yields. Interest rates have been falling since 1981, but may have hit their secular lows and may be on the rise for the rest of the decade. While yields were negative in nominal terms in most of Europe and Japan and negative in real terms in the United States, United Kingdom, Canada and Australia a year ago, bond yields are on the rise in almost all countries. European bond yields are now positive for maturities of five years and up.
We are uncertain either how far or how long the current trend in bear markets will last, but when bull markets return, instead of benefitting from declining bond yields and interest rates, as has been true during the past forty years, the stock market may be fighting against the headwinds of rising interest rates. With stock markets at all-time highs, events such as the Covid pandemic, Russia’s invasion of Ukraine, or other unexpected events can easily lead to new bear markets throughout the world. The decade of the 2020s will be truly different from the decade that preceded it.
