Previously there was a discussion of how financial markets in the United States perform once the US 2-Year treasury note closes above five percent. One of the main findings from looking back at prior periods is that, on a total return basis, the average 12-month stock market return was greater than the average return on three-month treasury bills. This finding was consistent no matter which way the federal funds rates (FFR) moved. The return on periods before those full twelve months shows a slightly different story. Looking three months later, the average return on 3-month treasuries has been consistently positive at around 1.1 percent. On the other hand, the average return for the S&P 500 has been negative to neutral. An investor would not expect positive returns on the broad index in the first three months after the US 2-Year Note closes above five percent.
|
|
US 3 Mo. T-bill Total Return |
S&P 500 Total Return |
||||
|
Average Return |
3 mo. out |
6 mo. out |
12 mo. out |
3 mo. out |
6 mo. out |
12 mo. out |
|
Higher FFR |
1.14% |
2.34% |
4.98% |
-2.07% |
0.17% |
6.54% |
|
Neutral or Lower FFR |
1.08% |
2.05% |
3.66% |
0.30% |
1.08% |
7.18% |
Figure 1: Periodic Returns in the US 3-Month and the S&P 500 Total
Return Indexes Based on Changes in the Federal Funds Rate
The beginning of this recent period began on March 8, 2023, when the US 2-Year treasury note closed at 5.05%, it is interesting to look at how financial markets have moved exactly three months later. We can see that the total return on the S&P 500 greatly outperformed the return on the 3-month treasury bill. In fact, looking at all the period instances individually, this is the largest positive three-month return for equities. The prior high was 5.7 percent in 1996. That 12-month return for equities for that instance happened to also be the largest positive return at 28.07 percent. We will have to see if the return from this instance follows the same pattern.
|
|
As of March 8, 2023 |
As of June 8, 2023 |
Percent Change |
|
Fed Funds Rate |
4.625 |
5.125 |
0.5% |
|
US 2 Year Yield |
5.05 |
4.52 |
-0.53% |
|
US 3-Mo. T-Bill Total Return |
11599.84512 |
11750.88601 |
1.30% |
|
US S&P 500 Total Return |
8530.33 |
9215.86 |
8.04% |
Figure 2: Three Month Change in the Federal Funds Rate and the US 2-Year Yield Along
with the Three Month Return in the US 3-Month and the S&P 500 Total Return Indexes
Economic Indicator: Unemployment
Focusing more on the markets in 1996, the yield on the US 2-Year note rose over the first three months while the level of the federal funds rate remained the same. Alone, this lack of movement would signal a more favorable environment for equities compared to fixed income. In the current period, the Federal Open Market Committee (FOMC) has raised rates multiple times, yet equities still outperformed. How can the stock market be higher with rising interest rates?
One perspective is to look at unemployment. The unemployment rate has been stubbornly low considering the number of measures that the Federal Reserve has undertaken since the start of the rate hiking cycle. Using the latest reported U3 unemployment rate from February 2023, the unemployment rate in early March 2023 was 3.6%. The corresponding rate three months later sits at 3.7%. Looking back at selected time periods when we had similar rises activity in the US 2-Year yield, you can see that the rising rates of unemployment correlated with recessions while there is not that much of a correlation with a bear market in equities. The positive correlation of rising unemployment with recession should not be a surprise since rising unemployment is a core factor in the NBER’s definition of a recession.
|
U3 Unemployment During Selected Periods when US 2Y Yield Breached 5 Percent |
||||||
|
Date |
Last Reported |
3 mo. out |
12 mo. out |
Annual Change |
Recession? (Y/N) |
Bear Market? (Y/N) |
|
12/31/1959 |
5.3 |
5.4 |
6.6 |
1.3 |
Y |
N |
|
2/28/1966 |
3.8 |
3.9 |
3.8 |
0 |
N |
Y |
|
8/30/1967 |
3.8 |
4 |
3.7 |
-0.1 |
N |
N |
|
4/30/1971 |
5.9 |
6 |
5.7 |
-0.2 |
N |
N |
|
6/30/1972 |
5.7 |
5.5 |
4.9 |
-0.8 |
N |
Y |
|
1/15/1992 |
7.3 |
7.4 |
7.4 |
0.1 |
N |
N |
|
3/18/1994 |
6.6 |
6.1 |
5.4 |
-1.2 |
N |
N |
|
2/20/1996 |
5.6 |
5.6 |
5.3 |
-0.3 |
N |
N |
|
2/23/1999 |
4.3 |
4.3 |
4 |
-0.3 |
N |
N |
|
5/10/2006 |
4.7 |
4.7 |
4.5 |
-0.2 |
N |
N |
|
6/7/2007 |
4.4 |
4.6 |
5.4 |
1.0 |
Y |
Y |
|
3/8/2023 |
3.6 |
3.7 |
??? |
??? |
??? |
Y |
Figure 3: Historical Change in the Unemployment Rate (U3) During the Selected Periods
and Whether There was a Recession and/or a Bear Market.
Since unemployment rates are lagging indicators, we can look at unemployment claims as an indicator that is more forward looking. Continuing claims not only gives an indication of recently unemployed people, but it also gives an indication of how long it takes for a person to obtain another job. We can look at prior recessions for an indication of how both measures perform as an indicator of economic stress. A chart during the Global Financial Crisis (GFC) shows an inflection in continuing unemployment claims activity prior to an increase in the unemployment rate and then leading the decline as the economy rebalanced.
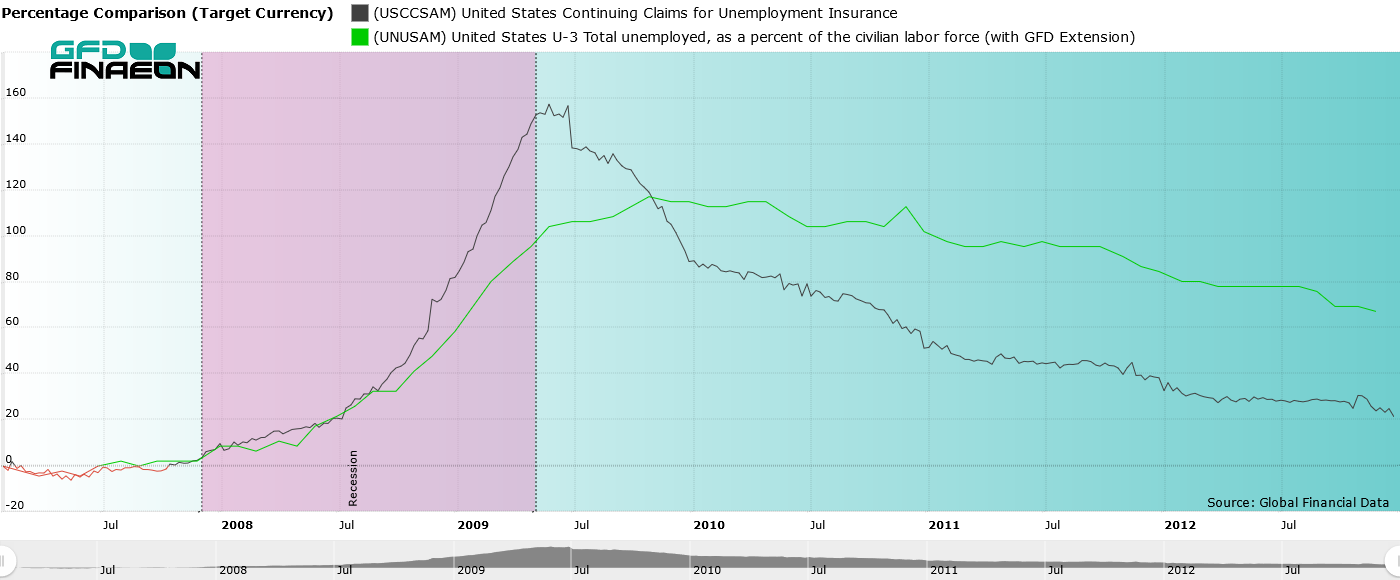
Figure 4: Percentage Change in US Continuing Claims and the Unemployment Rate (U3) During the Global Financial Crisis with Recessions.
Returning to the current period of financial stress that began in March 2023, the growth rate in continuing claims for unemployment had briefly increased in the weeks following the banks failures but has since decreased and is now at a lower level than it was before the March bank failures occurred. This indicator would not support an imminent downturn in economic activity. On the contrary, it would support an economy that is more resilient even with higher interest rates that are designed to slow investment and speculation.
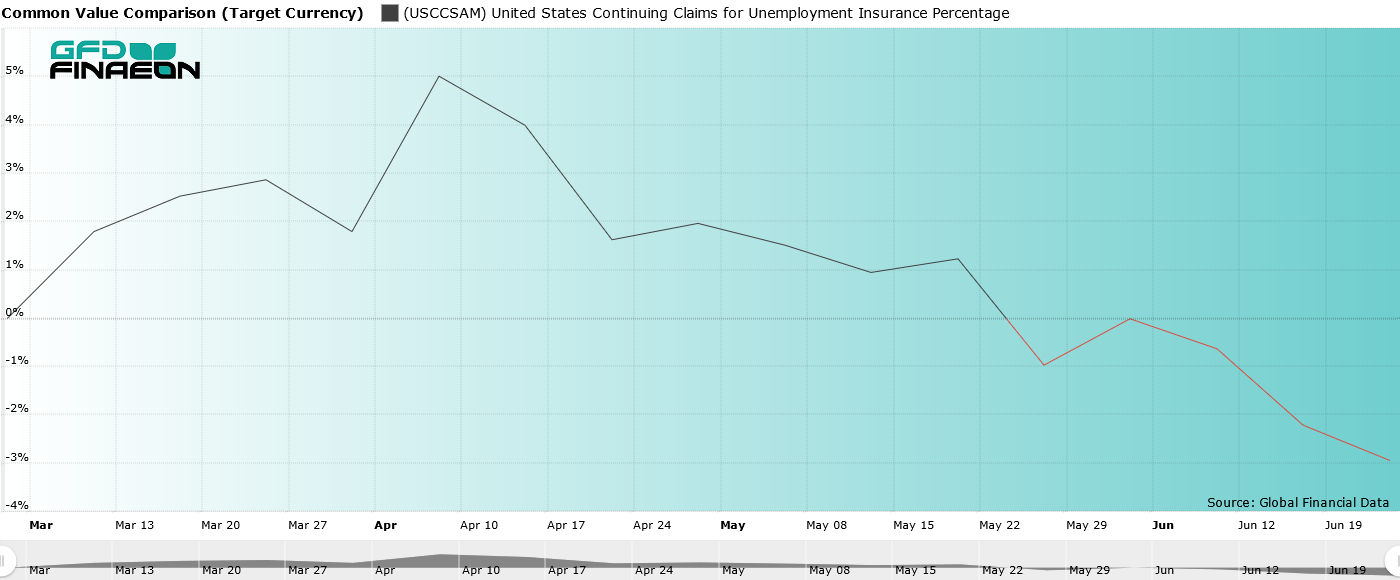
Figure 5: Percentage Change in US Continuing Claims from March 2023 to Present.
Economic Indicator: Inflation
Another perspective is to look at prices. The PCE Price Index (PCEPI) is a broad measure of changes in consumer prices. The PCEPI uses a broader set of prices than the Consumer Price Index (CPI) that is often referenced in popular media and is the preferred measure of inflation used by the Federal Reserve. Price movement in some highly weighted specific goods and/or services can still cause volatility on a month-to-month basis while doing year-over-year analysis could miss important movements that could have happened within that year. A three-month average is used to avoid monthly distortions while still attempting to capture movements that complete their cycle within the year.
In theory, higher inflation from this lagging indicator would cause yields on bonds to rise and make competing assets like equities less valuable. The higher cost of money would disincentivize business investment, resulting in increasing unemployment and slowing consumer spending. Higher annual percent changes did not have a clear relationship with equity bear markets nor could be an indicator that could be heavily relied upon to indicate future recession in the 12 months following an initial rise in the US two-year yield above five percent.
|
PCE Index During Selected Periods When US 2Y Yield Breached 5 Percent |
|||||
|
Date |
Last Reported 3 Month Average |
3 Mo Avg After 12 Mo |
Annual Period Percent Change in 3-Month Average |
Recession? (Y/N) |
Bear Market? (Y/N) |
|
12/31/1959 |
16.307 |
16.548 |
1.38% |
Y |
N |
|
2/28/1966 |
17.68733333 |
18.19466667 |
2.26% |
N |
Y |
|
8/30/1967 |
18.34433333 |
19.07466667 |
3.32% |
N |
N |
|
4/30/1971 |
21.54633333 |
22.352 |
2.92% |
N |
N |
|
6/30/1972 |
22.42966667 |
23.52966667 |
4.37% |
N |
Y |
|
1/15/1992 |
66.01166667 |
67.763 |
2.23% |
N |
N |
|
3/18/1994 |
69.443 |
71.00233333 |
1.85% |
N |
N |
|
2/20/1996 |
72.25666667 |
73.95966667 |
1.93% |
N |
N |
|
2/23/1999 |
75.43066667 |
76.98066667 |
1.94% |
N |
N |
|
5/10/2006 |
88.668 |
90.82133333 |
1.78% |
N |
N |
|
6/7/2007 |
91.09133333 |
94.01033333 |
2.73% |
Y |
Y |
|
3/8/2023 |
126.24 |
??? |
??? |
??? |
Y |
Figure 6: Historical Change in the PCE Index During the Selected Periods and Whether There was a Recession and/or a Bear Market.
Financial Indicator: Financial Stress
A narrower indicator can focus on the financial conditions since the flow of financial activity is often the prerequisite for any trade of nearly any size. Given that trade is the backbone of an economy, it is important to monitor financial conditions. The Chicago Fed provides the National Financial Conditions Index (NFCI) that is an index made up of many lagging, coincident and leading variables that are weighted to indicate current financial conditions relative to historical precedent. A positive number indicates tighter than average financial conditions while a negative number indicates looser than average financial conditions.
Prior research that has investigated the construction and methodology of the NFCI and has found it to be reliable measurement of financial stress in the markets. Particularly, subindexes that focus on leverage have often led the overall market into and out of extreme financial episodes. The Leverage Subindex includes financial companies. The Chicago Fed also provides a subindex composed of nonfinancial companies. This Nonfinancial Leverage Subindex (NLS) provides a closer indicator of the desire of both individual households and nonfinancial businesses to invest in assets. When the subindex is positive, this gives an indication that there is a greater probability of dropping asset values and subsequent deleveraging that may accelerate stress on financial markets.
The period starting in February 1996 can be described with a Fed Funds Policy that was steady at 5.25 percent with rising two-year yields in the initial three months that then hovered around six percent for the rest of the 12-month period. In that period both the main NFCI and the NLS indicated looser than average financial conditions. The lack of financial stress encouraged equity prices to appreciate.
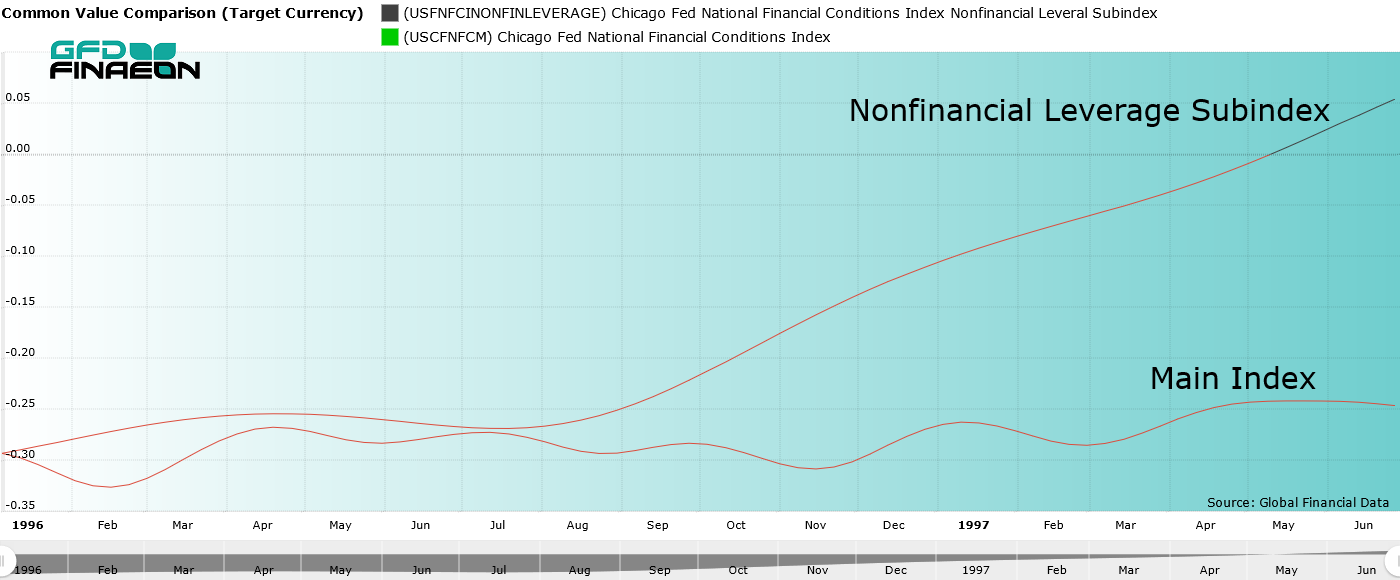
Figure 7: NFCI and NLS during the mid-1990s.
A more challenging time would be the GFC period. In this case, you can see the NLS rose well before and even peaked before the NFCI accelerated higher. The NFCI had greater volatility following the recession, possibly, in part, due to the second implementation of quantitative easing and its greater effect on financial companies. You can see below that the Leverage Subindex, that includes financial companies, remained higher than the NFCI highlighting the impact that the health of financial companies had on the main index. You can also see the convergence of the NLS and Leverage Subindex in 2007 and the beginning of 2008. That deleveraging among financial companies was an imminent signal of the economic conditions that would come during the GFC. Of course, the ongoing strained financial conditions indicated by the NLS ran ahead of the Leverage Subindex as these banks and investment firms failed due to widespread asset mispricing and speculation.
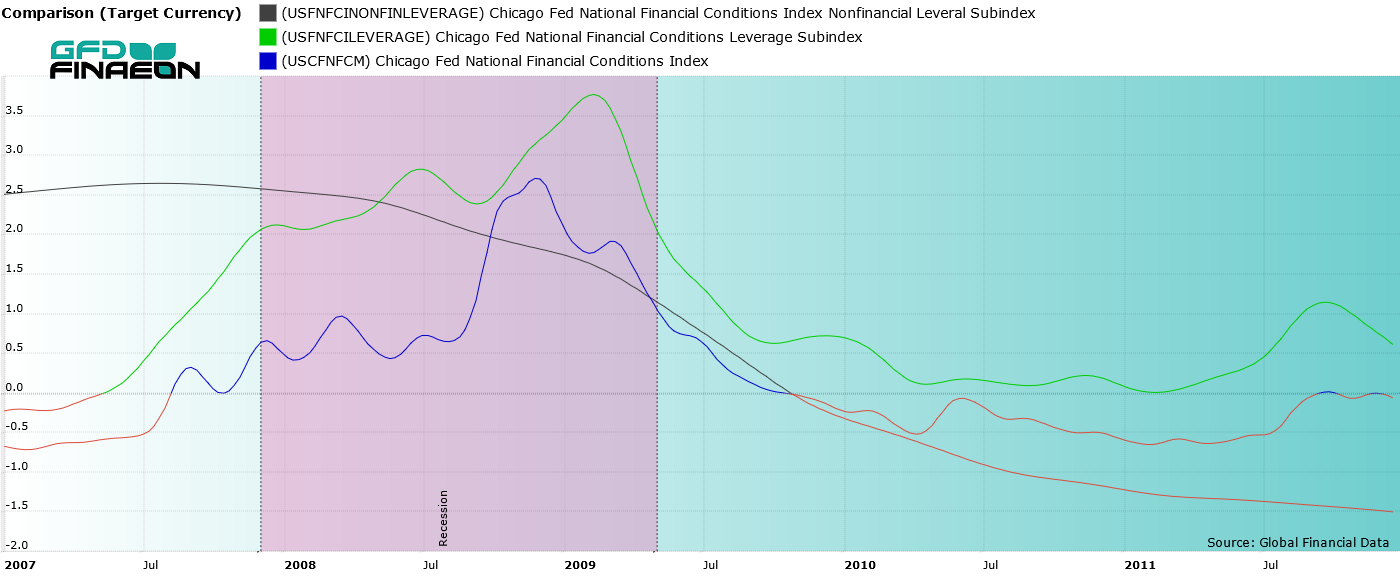 Figure 8: NFCI, NLS and the Leverage Subindex during the GFC.
When we turn to the period from the beginning of the pandemic shutdowns to the present, we see that there is an acceleration of financial stress in the NLS during the first months of the shutdown. This is not surprising considering “non-essential” retail and manufacturing businesses were shuttered and consumer activity was constrained. The amount of fiscal stimulus and monetary easing no doubt contributed to the short-lived financial stress indicated by the NLS at the beginning of this period.
You can also see the brief and muted rises in the NLS as inflation became an issue and again during the regional bank failures in March 2023. Actions by the Federal Reserve in the immediate days following the failure of Silicon Valley Bank most likely increased confidence in the financial system and headed off any acceleration in the NLS that would accompany a challenge to the solvency of the financial system.
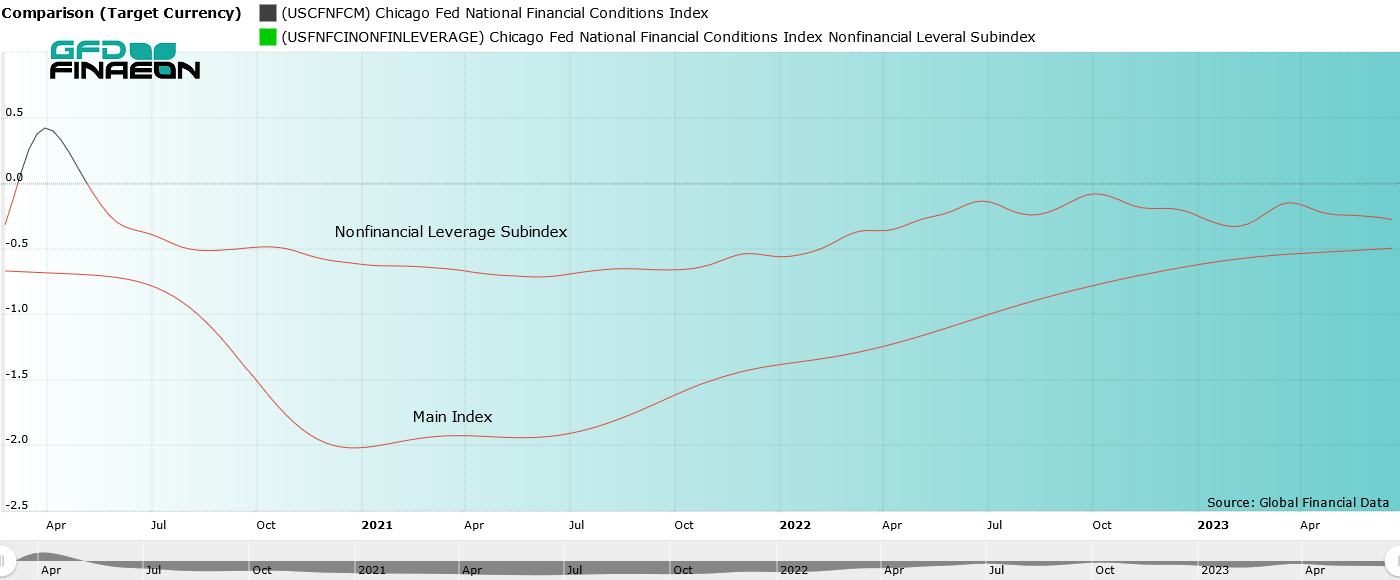
Figure 9: NFCI and NLS during from March 2020 to June 2023.
Recapping the Past and What it Tells Us About Future Possibilities
Using a sample where the closing yield on the US 2-Year Note initially breached five percent, the initial three-month period ending on June 8, 2023 was the largest return for the S&P 500 index. Data from lagging and leading indicators show a disinflationary trend in economic prices along with robust employment that provided a favorable environment for risk assets. Given the rise in equity prices and the improving, but still uncertain, economic conditions, what can we look forward to for the remainder of this 12-month period?
Sometimes, a five percent yield on the two-year note indicates troubling financial times ahead. In the present period, we immediately saw that with the regional bank failures. Yield curves remain inverted, the FOMC continued to raise the FFR even with the bank failures and looks to continue to hike the official rate in the near future. Equity markets, so far, have refused to take notice. One critique of the current rally is that the majority of the positive performance of equities can be attributed to only a small subset of the overall index, large cap technology companies. While this is true, it does not mean that other areas of the market will not catch up to those companies provided that economic conditions do not deteriorate.
To this end, the S&P 500 reached and surpassed the 20 percent level rise from the lows in October 2022. Some were quick to call this recent rally the start of a new bull market. However, the 20 percent level has not been immune for premature calls. In 2008, the S&P 500 rose 20 percent from the recent low and yet failed to hold and continued further on down to form a new low. GFD defines a new bull market as either a 50 percent increase from the low or a new all-time high in the major index. The S&P 500 did not drop far enough for the 50 percent level criteria to matter. The index has yet to achieve a new all-time high so for the time-being we cannot confidently state that we are in a new bull market. While the current momentum is clearly favoring holders of risk assets, it is important to recognize that there is still uncertainty about the future direction of the economy and financial markets.
