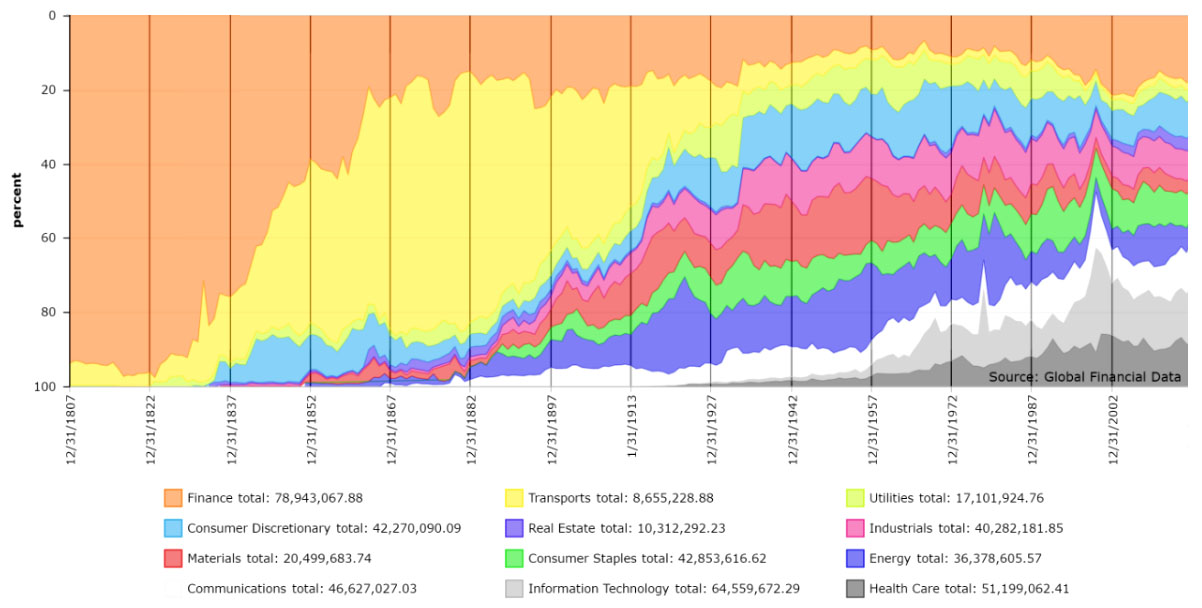
The historical depth of the GFD Indices is unsurpassed
While other sources may have calculated thousands of current indices on stocks, bonds, and bills that begin in the 1980s, only Global Financial Data delivers the whole picture.
GFD Equity Indices
GFD Bond Indices
GFD Bill Indices
GFD Commodity Indices
Global Financial Data has used proprietary research on global stock markets and individual securities to create benchmark indices that have never before been released. GFD has produced the most extensive set of total return series for stocks, bonds, bills and commodities for all major countries. Some of these alternative indices include:
GFD Emerging Market Stock Index which begins in 1602
GFD UK-100 Index which begins in 1692
GFD US-100 Index which beings in 1602
GFD World Index which begins in 1602
GFD World x/USA Index which begins in 1602
GFD Equity Indices provide centuries of information on stock prices, total returns, sector indices and dividend yields, since the first stock market in Amsterdam in 1601. Our proprietary research has allowed us to generate an index for the US stocks beginning in 1792, for UK stocks beginning in 1692 and for the world and emerging markets beginning in 1602.
GFD has used its extensive historical database to produce bill indices that begin in 1694. GFD’s data on hundreds of sovereign bonds has been used to create bond indices that begin in 1700. Global Financial Data has aggregated the bond indices of different countries into 20 international bond indices organized by geographic region.
Using its rich database of commodity prices, GFD has put together commodity indices that follow the path of energy, agricultural and non-agricultural commodities over the past millennium. Using price data from over 50 commodities, these monthly indices capture long-term trends as no other set of indices could. Explore these exciting new GFD Indices today.


