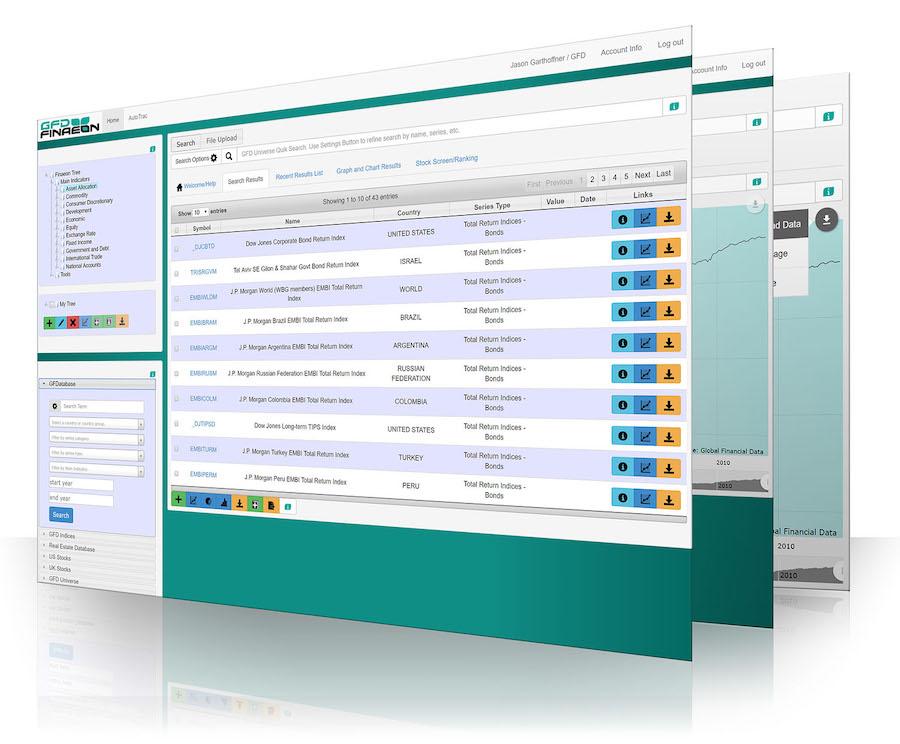
An Advanced Analytics Platform
GFD Finaeon enables users to choose from a vast cross section of GFD’s unparalleled data while performing complex mathematical analysis. Driven by financial and economic historical data, with some data sets extending back over 1,000 years, GFD Finaeon gives you the power to identify hidden opportunities that will maximize your returns.
Search individual or lists of symbols
Use the GFDUniverse search tool to search by individual symbol, type a list with commas separation, or upload a .csv file.
New “Recent Results” list.
Gather multiple search results into a “recent Results” list, that you can run charts on, download or save to portfolios (coming soon).
GFD Finaeon Tree
Easily search Main Indicators like fixed income rates, government debt, etc as well as tools for Yield Curves, CAPE Ratios and MORE!
NEW Charts and Graphs
All-New charts are interactive, with pan and zoom (drill down) controls and a big increase in rendering speed.
Charting Options
Comparison Charts, Technical Indicators, Financial Ratios, and Historical Overlays are among many new improvements.
Analysis
Financial charting capabilities including Candlestick, Mountain, Open-High-Low-Close (OHLC) and long-term trend analysis.
On-Demand Downloading
No more queuing. Downloads are performed on demand with real-time status displayed.
Download Options
Choose stacked or pivoted data, include fundamental data, and many more options in just a few clicks.
API
Use GFD’s Application Programming Interface – API – to automate and download large datasets.


